BITF Daily Technical Analysis
Bitfarms Ltd
Bitcoin mining, High-Performance Computing (HPC) and Artificial Intelligence (AI) infrastructure
BITF Technical Analysis Summary
The long-term technical outlook is decidedly bullish, driven by a massive rounding bottom breakout that has propelled the asset into a powerful, high-volume uptrend well above all major moving averages. However, in the short term, caution is warranted. A bearish MACD crossover, negative histogram expansion, and a declining RSI from overbought extremes strongly suggest momentum is exhausted, increasing the probability of a near-term consolidation or pullback toward the $5.00 support zone.
Included In Lists
Related Tickers of Interest
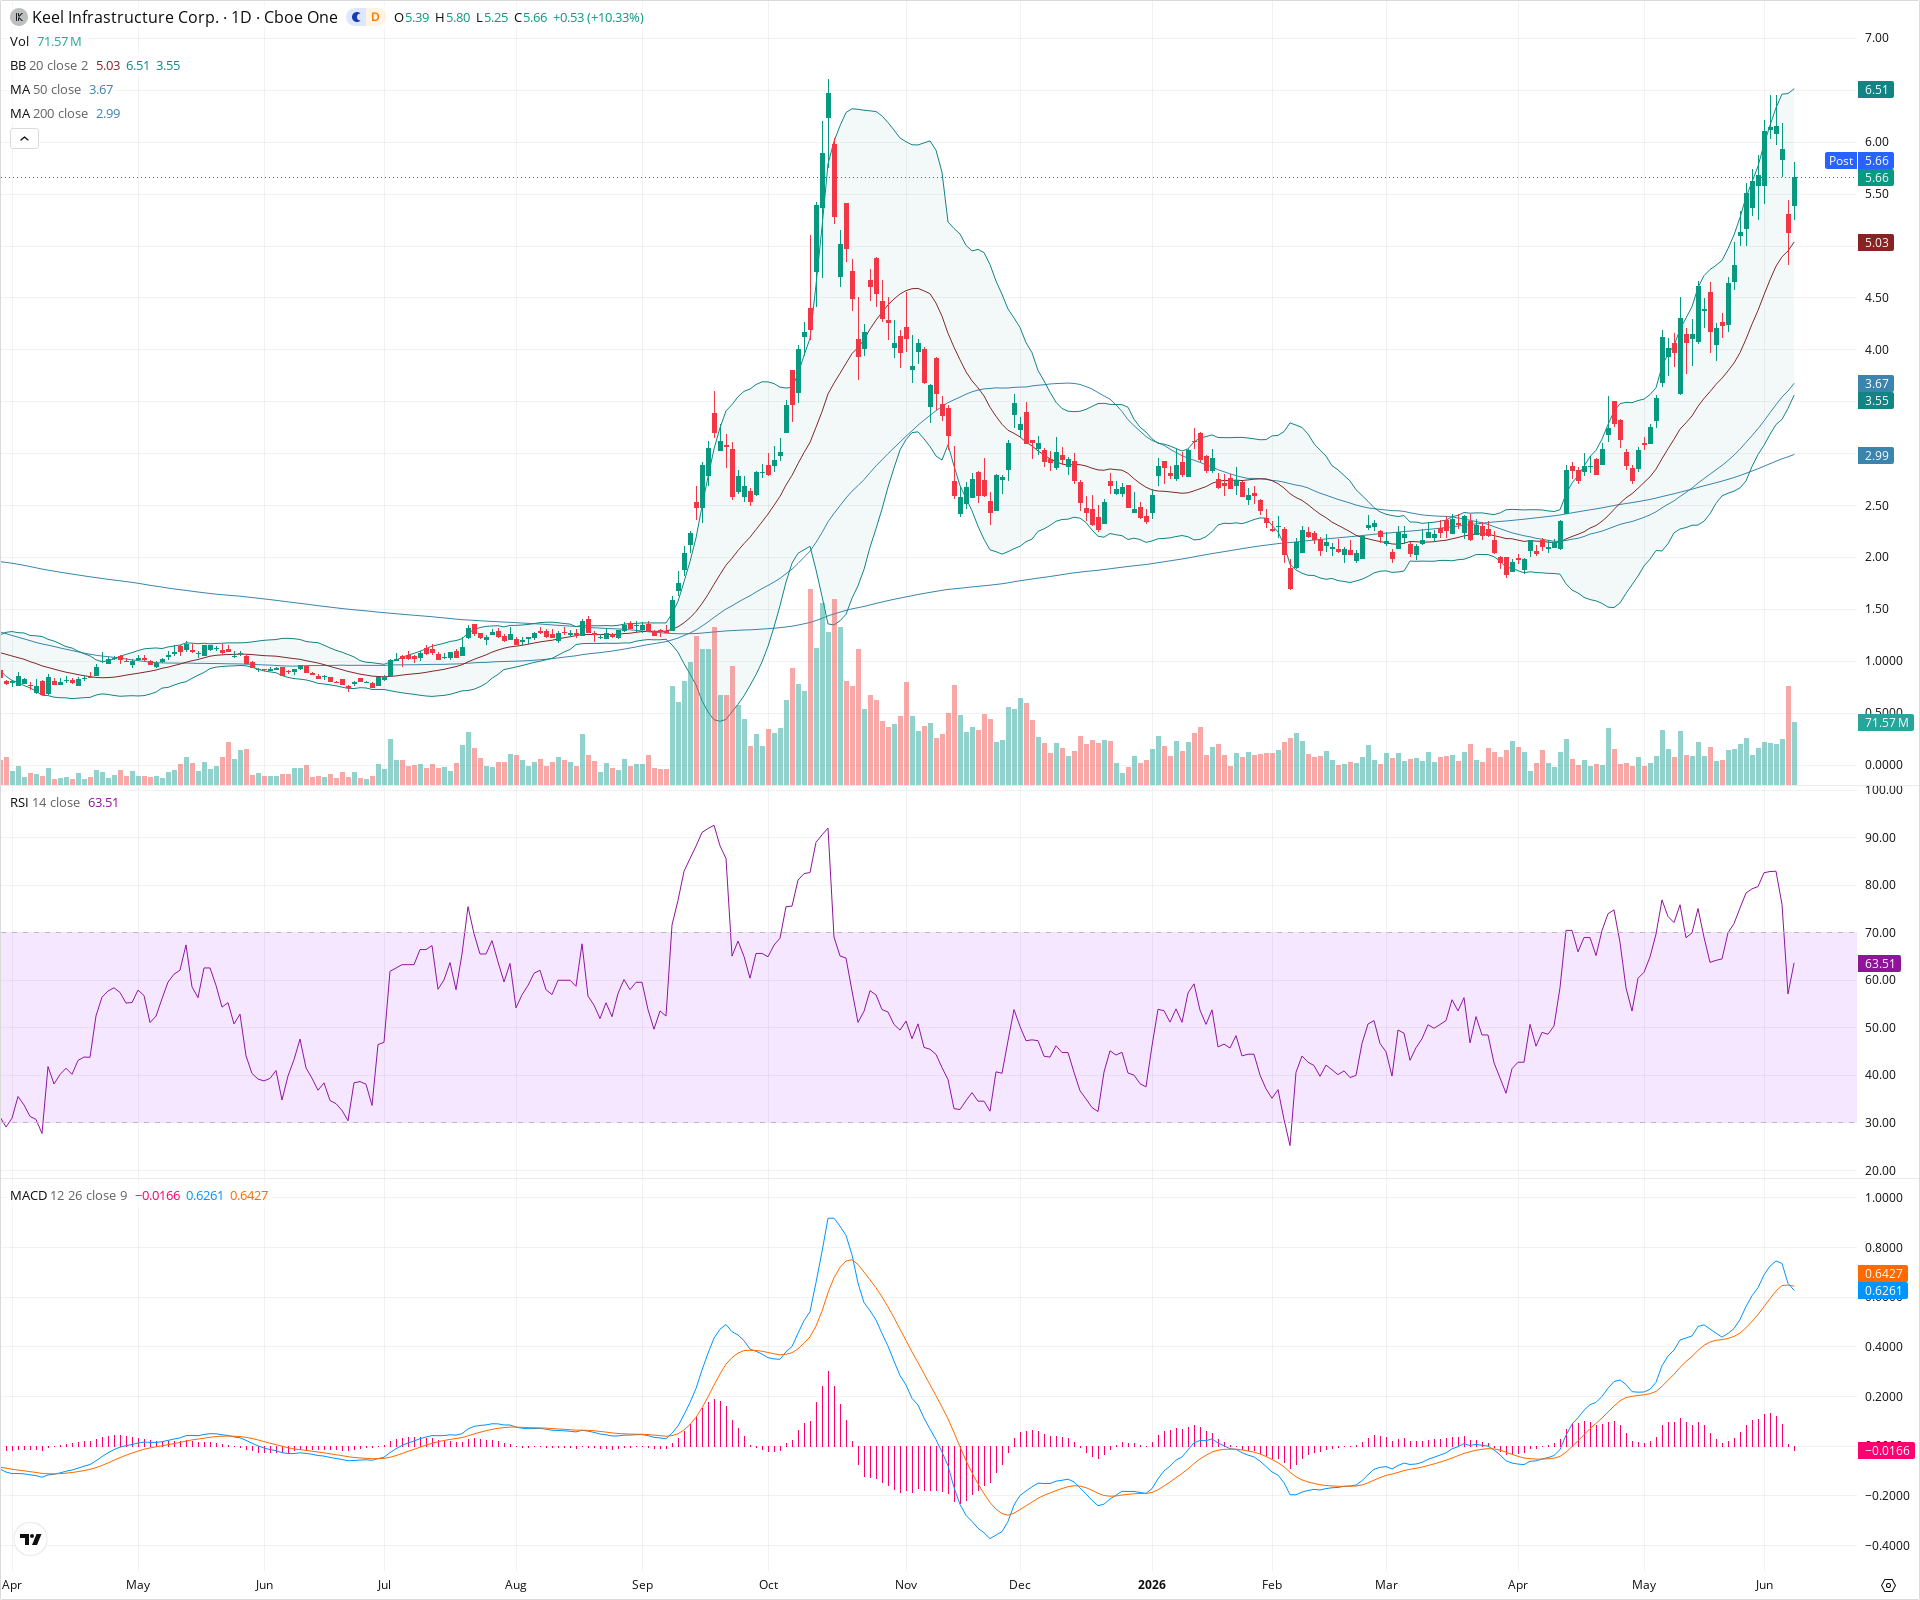
BITF Daily Chart
Sentiment
Short-term Sentiment (days to weeks): Neutral
While the primary price trend remains upward, short-term momentum is waning. The MACD has registered a bearish crossover (MACD line fell below the signal line) with a negative histogram, and the RSI has retreated from highly overbought levels, suggesting an imminent period of consolidation or a minor pullback.
Long-term Sentiment (weeks to months): Bullish
The long-term structure is robustly positive. The price has executed a massive breakout from a multi-month base, establishing a strong uptrend characterized by higher highs and higher lows, and is currently trading well above the rising 50-day and 200-day simple moving averages.
Report Metadata
- Timeframe: daily
- Generated at: 2026-06-08T21:13:56.519Z
- Model: gemini-3.1-pro-preview
Support Price Levels
| Level | Range | Strength | Notes |
|---|---|---|---|
| $5.00 | $4.80 - $5.20 | Strong | Recent consolidation zone during the current leg up, coinciding with the psychological $5.00 level. |
| $3.65 | $3.50 - $3.80 | Strong | Area of the rising 50-day SMA and a significant prior base built before the latest parabolic advance. |
| $3.00 | $2.80 - $3.20 | Weak | The primary macro breakout level and current vicinity of the 200-day SMA. |
Resistance Price Levels
| Level | Range | Strength | Notes |
|---|---|---|---|
| $6.26 | $6.00 - $6.51 | Strong | The recent swing high and absolute peak of the current parabolic run. |
| $7.00 | $6.80 - $7.20 | Strong | Historical peak resistance visible on the far left side of the chart. |
Potential Chart Patterns in Formation
| Strength | Pattern | Signal | Target | Details |
|---|---|---|---|---|
| Strong | Rounding Bottom / Cup Formation | Bullish | N/A | A massive, macro-level rounded base spanning the majority of the visible chart, culminating in a powerful upside breakout that is now challenging prior historical highs. |
| Strong | Parabolic Advance | Neutral | N/A | The recent price action has accelerated sharply upward, causing significant separation from the 50-day and 200-day moving averages, indicating highly speculative momentum that often precedes sharp corrections. |
Frequently Asked Questions about BITF
What is the current sentiment for BITF?
The short-term sentiment for BITF is currently Neutral because While the primary price trend remains upward, short-term momentum is waning. The MACD has registered a bearish crossover (MACD line fell below the signal line) with a negative histogram, and the RSI has retreated from highly overbought levels, suggesting an imminent period of consolidation or a minor pullback.. The long-term trend is classified as Bullish.
What are the key support levels for BITF?
StockDips.AI has identified key support levels for BITF at $5.00 and $3.65. These levels may represent potential accumulation zones where buying interest could emerge.
Is BITF in a significant dip or a Value Dip right now?
BITF has a Value Score of 26/100. It is not currently flagged as a significant dip in the Top Dips list. It is not listed as a Value Dip because the long-term sentiment or value-score threshold does not qualify.
View the full interactive analysis on StockDips.AI.