BITF Weekly Technical Analysis
Bitfarms Ltd
Bitcoin mining, High-Performance Computing (HPC) and Artificial Intelligence (AI) infrastructure
BITF Technical Analysis Summary
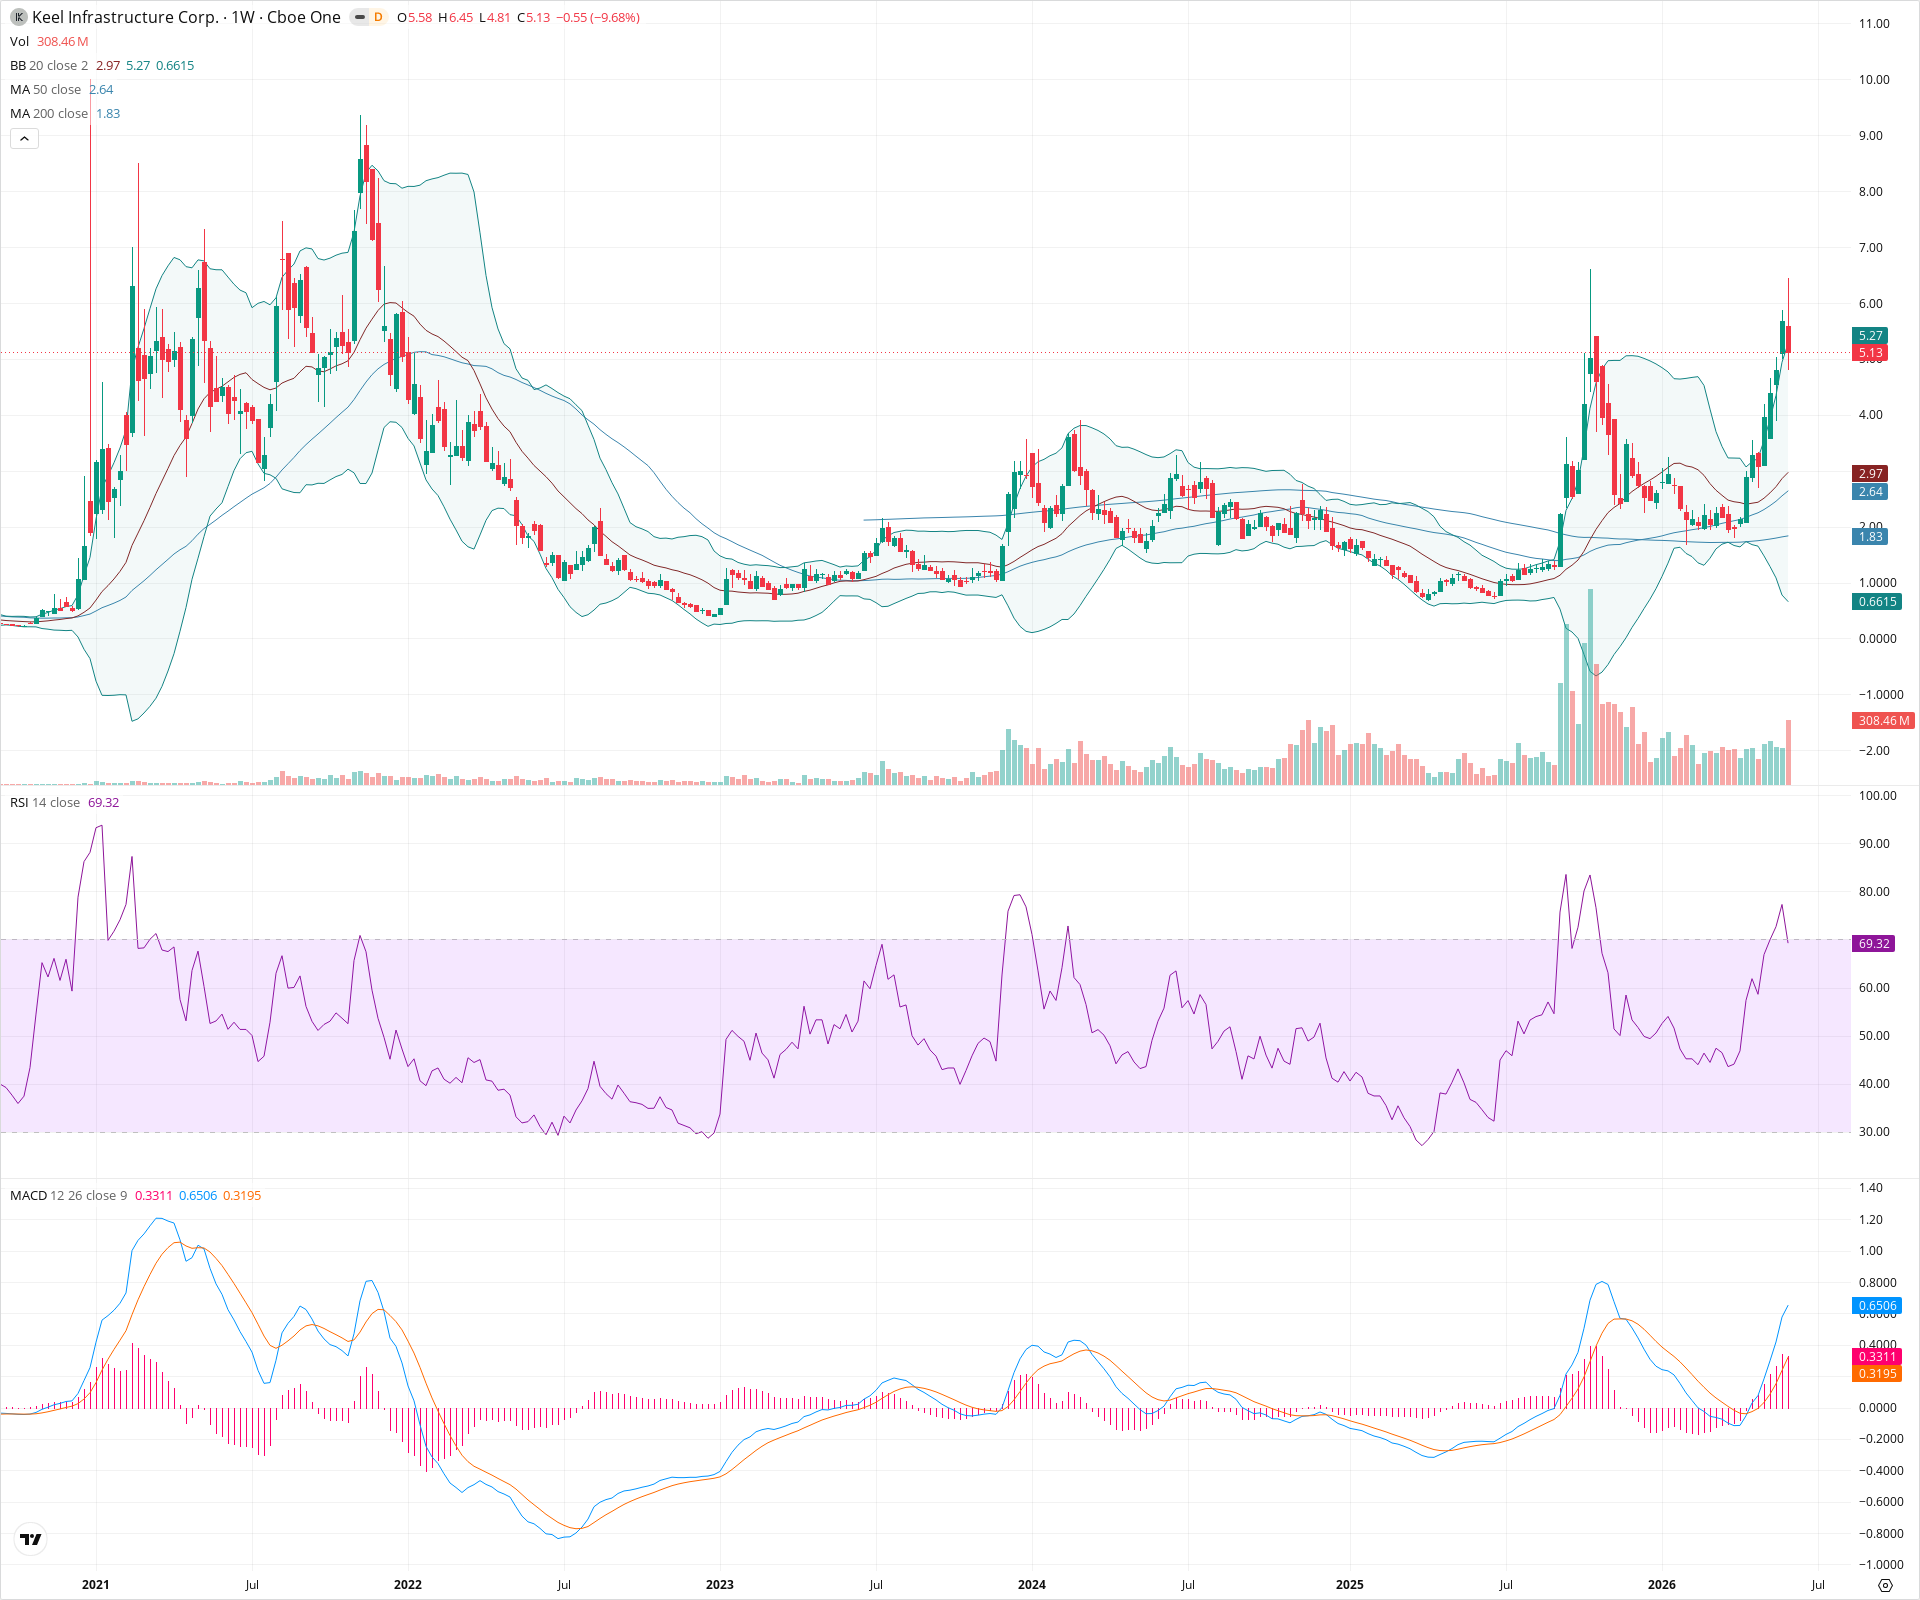
The weekly chart demonstrates a well-established structural uptrend, with price making higher highs and higher lows. Recent price action shows a strong bounce off moving average confluence, supported by expanding bullish MACD momentum. Long-term sentiment remains constructive as long as price holds above the 50-week and 200-week MA cluster near 2.50-3.00.
Included In Lists
Related Tickers of Interest
BITF Weekly Chart
Sentiment
Short-term Sentiment (days to weeks): Bullish
Price is rebounding strongly off the 20 and 50-week MAs, with MACD crossing bullish above zero and expanding.
Long-term Sentiment (weeks to months): Bullish
Price is making higher highs and higher lows structurally, supported by an upward-sloping 50-week MA above a flat/rising 200-week MA.
Report Metadata
- Timeframe: weekly
- Generated at: 2026-06-06T09:12:09.718Z
- Model: gemini-3.1-pro-preview
Support Price Levels
| Level | Range | Strength | Notes |
|---|---|---|---|
| $2.75 | $2.50 - $3.00 | Strong | Confluence of the 50-week MA, 200-week MA, and recent structural swing lows. |
| $1.75 | $1.50 - $2.00 | Strong | Major multi-year base structural support level. |
Resistance Price Levels
| Level | Range | Strength | Notes |
|---|---|---|---|
| $6.25 | $6.00 - $6.50 | Strong | Recent weekly swing highs acting as immediate resistance. |
| $8.50 | $7.50 - $9.50 | Strong | Major historical peaks from previous multi-year structural highs. |
Potential Chart Patterns in Formation
| Strength | Pattern | Signal | Target | Details |
|---|---|---|---|---|
| Strong | Ascending Channel / Uptrend | Bullish | N/A | Price has been forming a steady sequence of higher highs and higher lows since late 2022/early 2023. |
Frequently Asked Questions about BITF
What is the current sentiment for BITF?
The short-term sentiment for BITF is currently Bullish because Price is rebounding strongly off the 20 and 50-week MAs, with MACD crossing bullish above zero and expanding.. The long-term trend is classified as Bullish.
What are the key support levels for BITF?
StockDips.AI has identified key support levels for BITF at $2.75 and $1.75. These levels may represent potential accumulation zones where buying interest could emerge.
Is BITF in a significant dip or a Value Dip right now?
BITF has a Value Score of 26/100. It is not currently flagged as a significant dip in the Top Dips list. It is not listed as a Value Dip because the long-term sentiment or value-score threshold does not qualify.
View the full interactive analysis on StockDips.AI.