BKKT Weekly Technical Analysis
Bakkt Holdings, Inc
A financial technology company that operates a digital asset platform.
BKKT Technical Analysis Summary
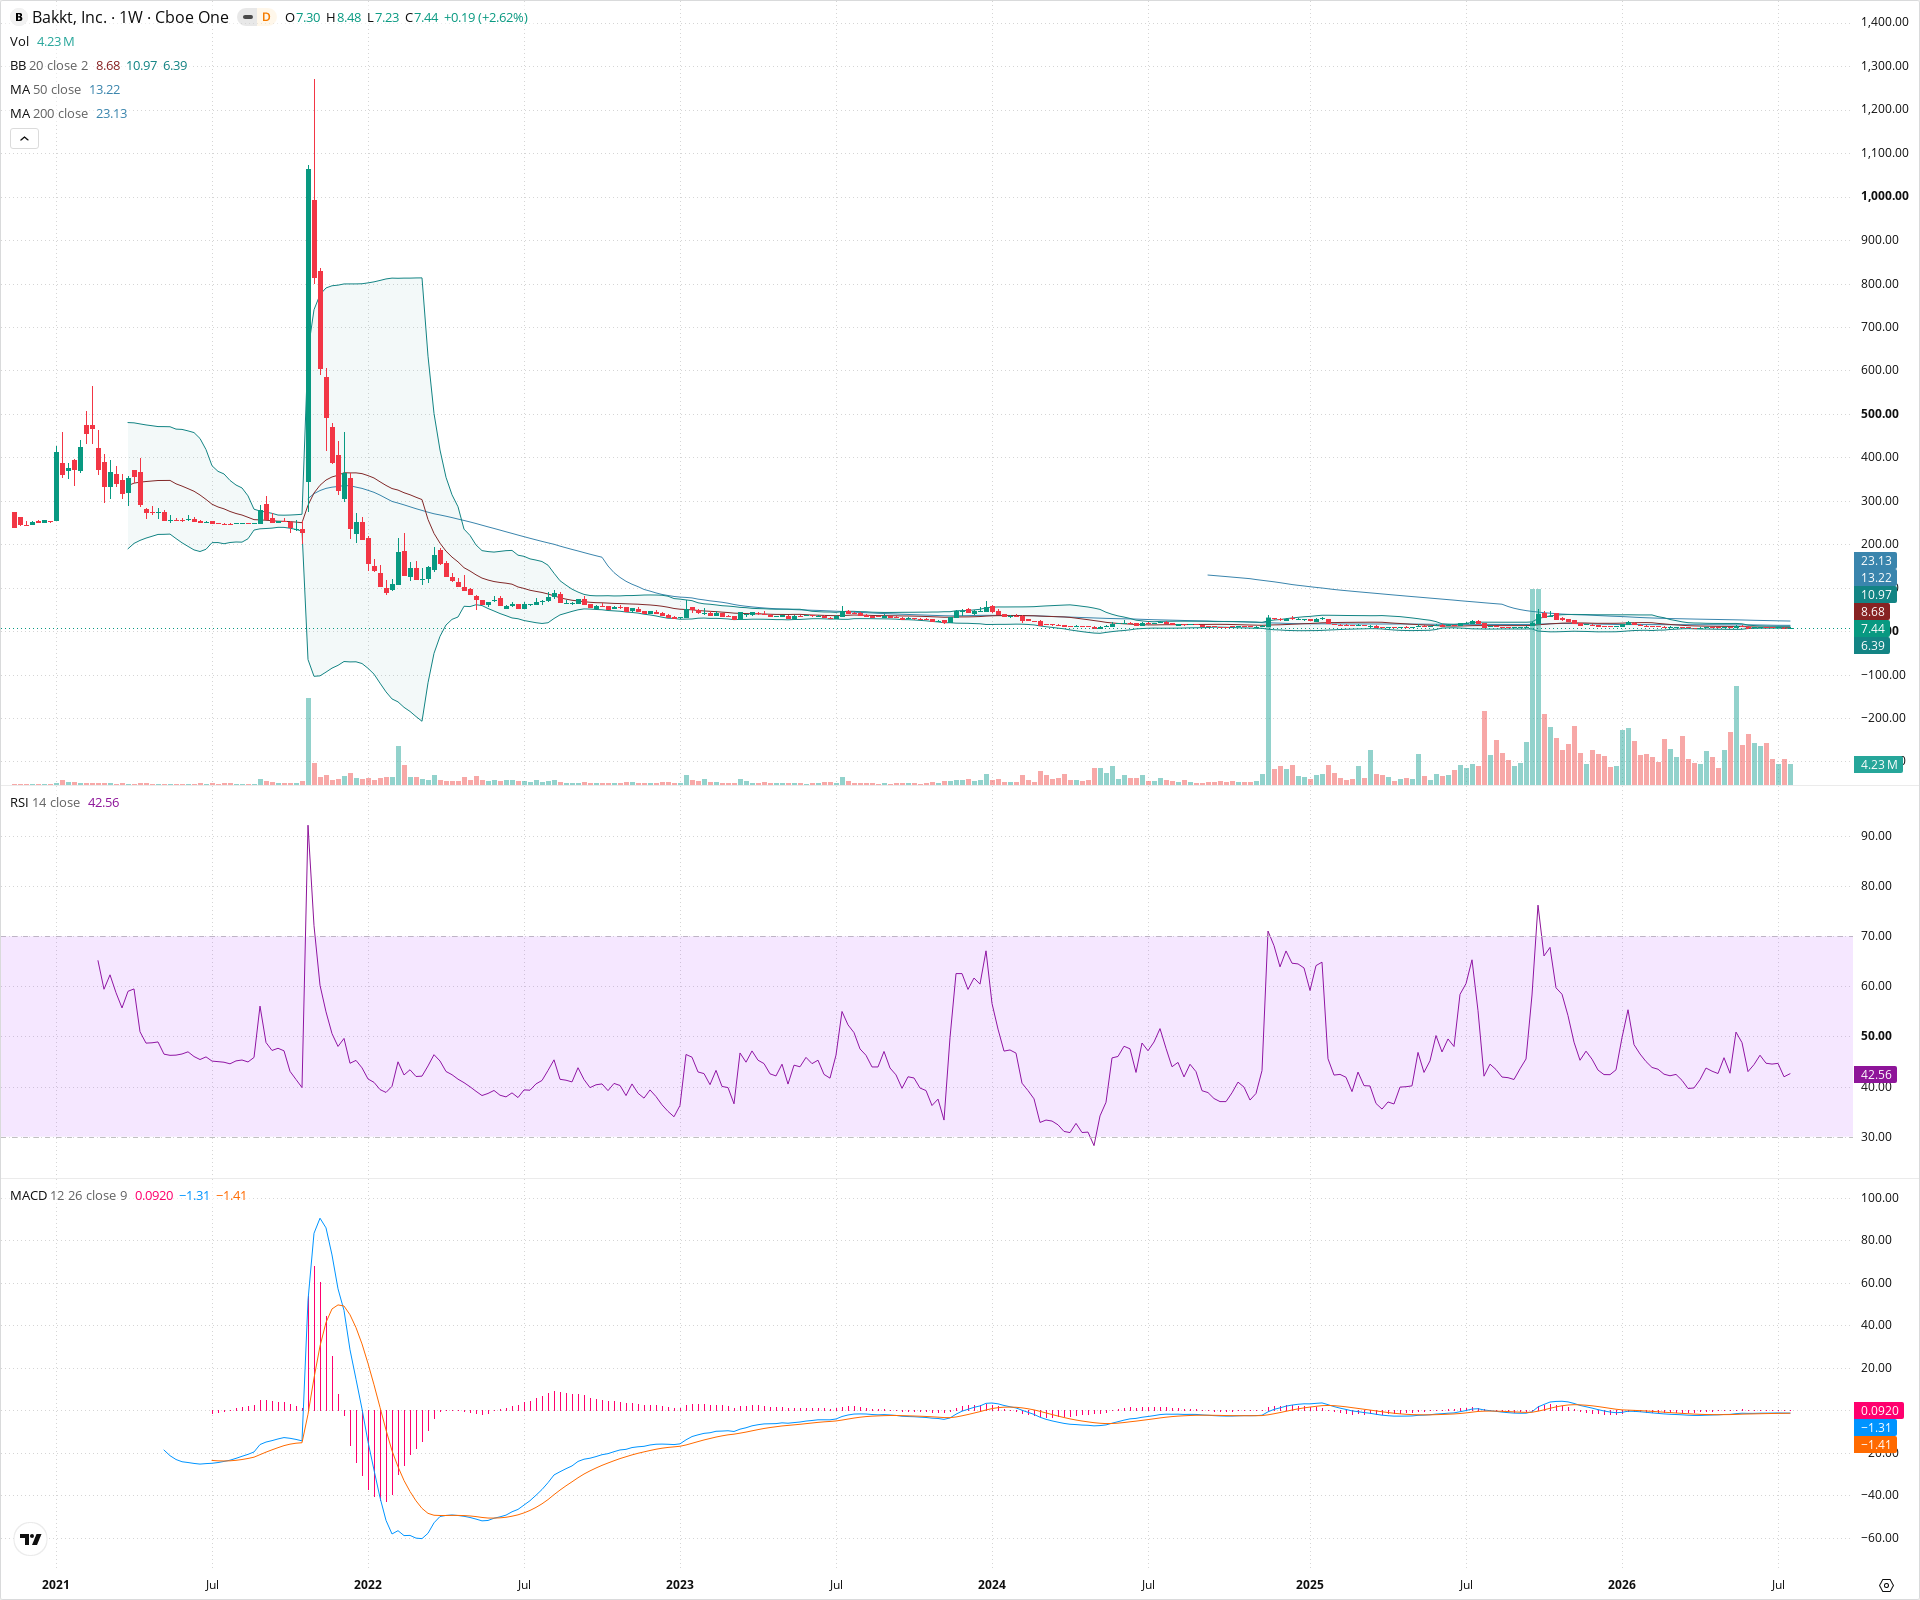
BKKT is technically severely damaged, remaining in a prolonged L-shaped recovery phase following a massive speculative collapse. The asset is currently entirely range-bound at absolute historical lows, characterized by extremely low volatility and a lack of momentum. While the aggressive selling has stopped, resulting in a multi-year consolidation base, the long-term trend remains structurally bearish as long as the price trades significantly below its major downward-sloping 50-week and 200-week moving averages.
Included In Lists
Related Tickers of Interest
BKKT Weekly Chart
Sentiment
Short-term Sentiment (days to weeks): Neutral
The price is consolidating sideways in an extremely tight range near historical lows. RSI is hovering in neutral territory (~42) and the MACD is virtually flat, indicating a complete lack of short-term directional momentum.
Long-term Sentiment (weeks to months): Bearish
The asset remains in a massive, multi-year structural downtrend following a near-total collapse from its 2021 highs. Price action is firmly trapped below downward-sloping 50-week and 200-week simple moving averages.
Report Metadata
- Timeframe: weekly
- Generated at: 2026-07-25T09:12:18.299Z
- Model: gemini-3.1-pro-preview
Support Price Levels
| Level | Range | Strength | Notes |
|---|---|---|---|
| $5.75 | $5.00 - $6.50 | Strong | The multi-year absolute floor; the bottom edge of the current extended sideways consolidation phase where selling pressure has dried up. |
Resistance Price Levels
| Level | Range | Strength | Notes |
|---|---|---|---|
| $9.25 | $8.50 - $10.00 | Weak | Immediate near-term resistance defined by the flat 20-week SMA (middle Bollinger Band). |
| $13.50 | $12.00 - $15.00 | Strong | Significant overhead resistance zone aligning with the downward-sloping 50-week SMA. |
| $22.50 | $20.00 - $25.00 | Strong | Major historical structural resistance and the current location of the 200-week SMA. |
Potential Chart Patterns in Formation
| Strength | Pattern | Signal | Target | Details |
|---|---|---|---|---|
| Strong | Multi-year Consolidation Base | Neutral | N/A | Following a massive historical crash, the price has spent well over a year flatlining in a very tight range near zero relative to its former peak, indicating a prolonged period of equilibrium or base-building. |
| Strong | Bollinger Band Squeeze | Neutral | N/A | The weekly Bollinger Bands have contracted severely, reflecting historically low volatility. While it suggests a significant move is eventually coming, the direction remains uncertain pending a breakout of the consolidation range. |
Frequently Asked Questions about BKKT
What is the current sentiment for BKKT?
The short-term sentiment for BKKT is currently Neutral because The price is consolidating sideways in an extremely tight range near historical lows. RSI is hovering in neutral territory (~42) and the MACD is virtually flat, indicating a complete lack of short-term directional momentum.. The long-term trend is classified as Bearish.
What are the key support levels for BKKT?
StockDips.AI has identified key support levels for BKKT at $5.75. These levels may represent potential accumulation zones where buying interest could emerge.
Is BKKT in a significant dip or a Value Dip right now?
BKKT has a Value Score of 66/100. It is not currently flagged as a significant dip in the Top Dips list. It is not listed as a Value Dip because the long-term sentiment or value-score threshold does not qualify.
View the full interactive analysis on StockDips.AI.