CAVA Daily Technical Analysis
Cava Group Inc
Fast-casual restaurant chain offering Mediterranean bowls, pitas, and salads.
CAVA Technical Analysis Summary
CAVA has experienced a severe technical breakdown, confirming a massive Head and Shoulders topping pattern and losing major support levels, including the 200-day moving average. Downward momentum is currently very strong across all indicators (MACD, Bollinger Bands, Volume). Long-term investors should be cautious as the technical posture has shifted decisively bearish, with the next significant structural support lying lower in the mid-50s.
Included In Lists
Related Tickers of Interest
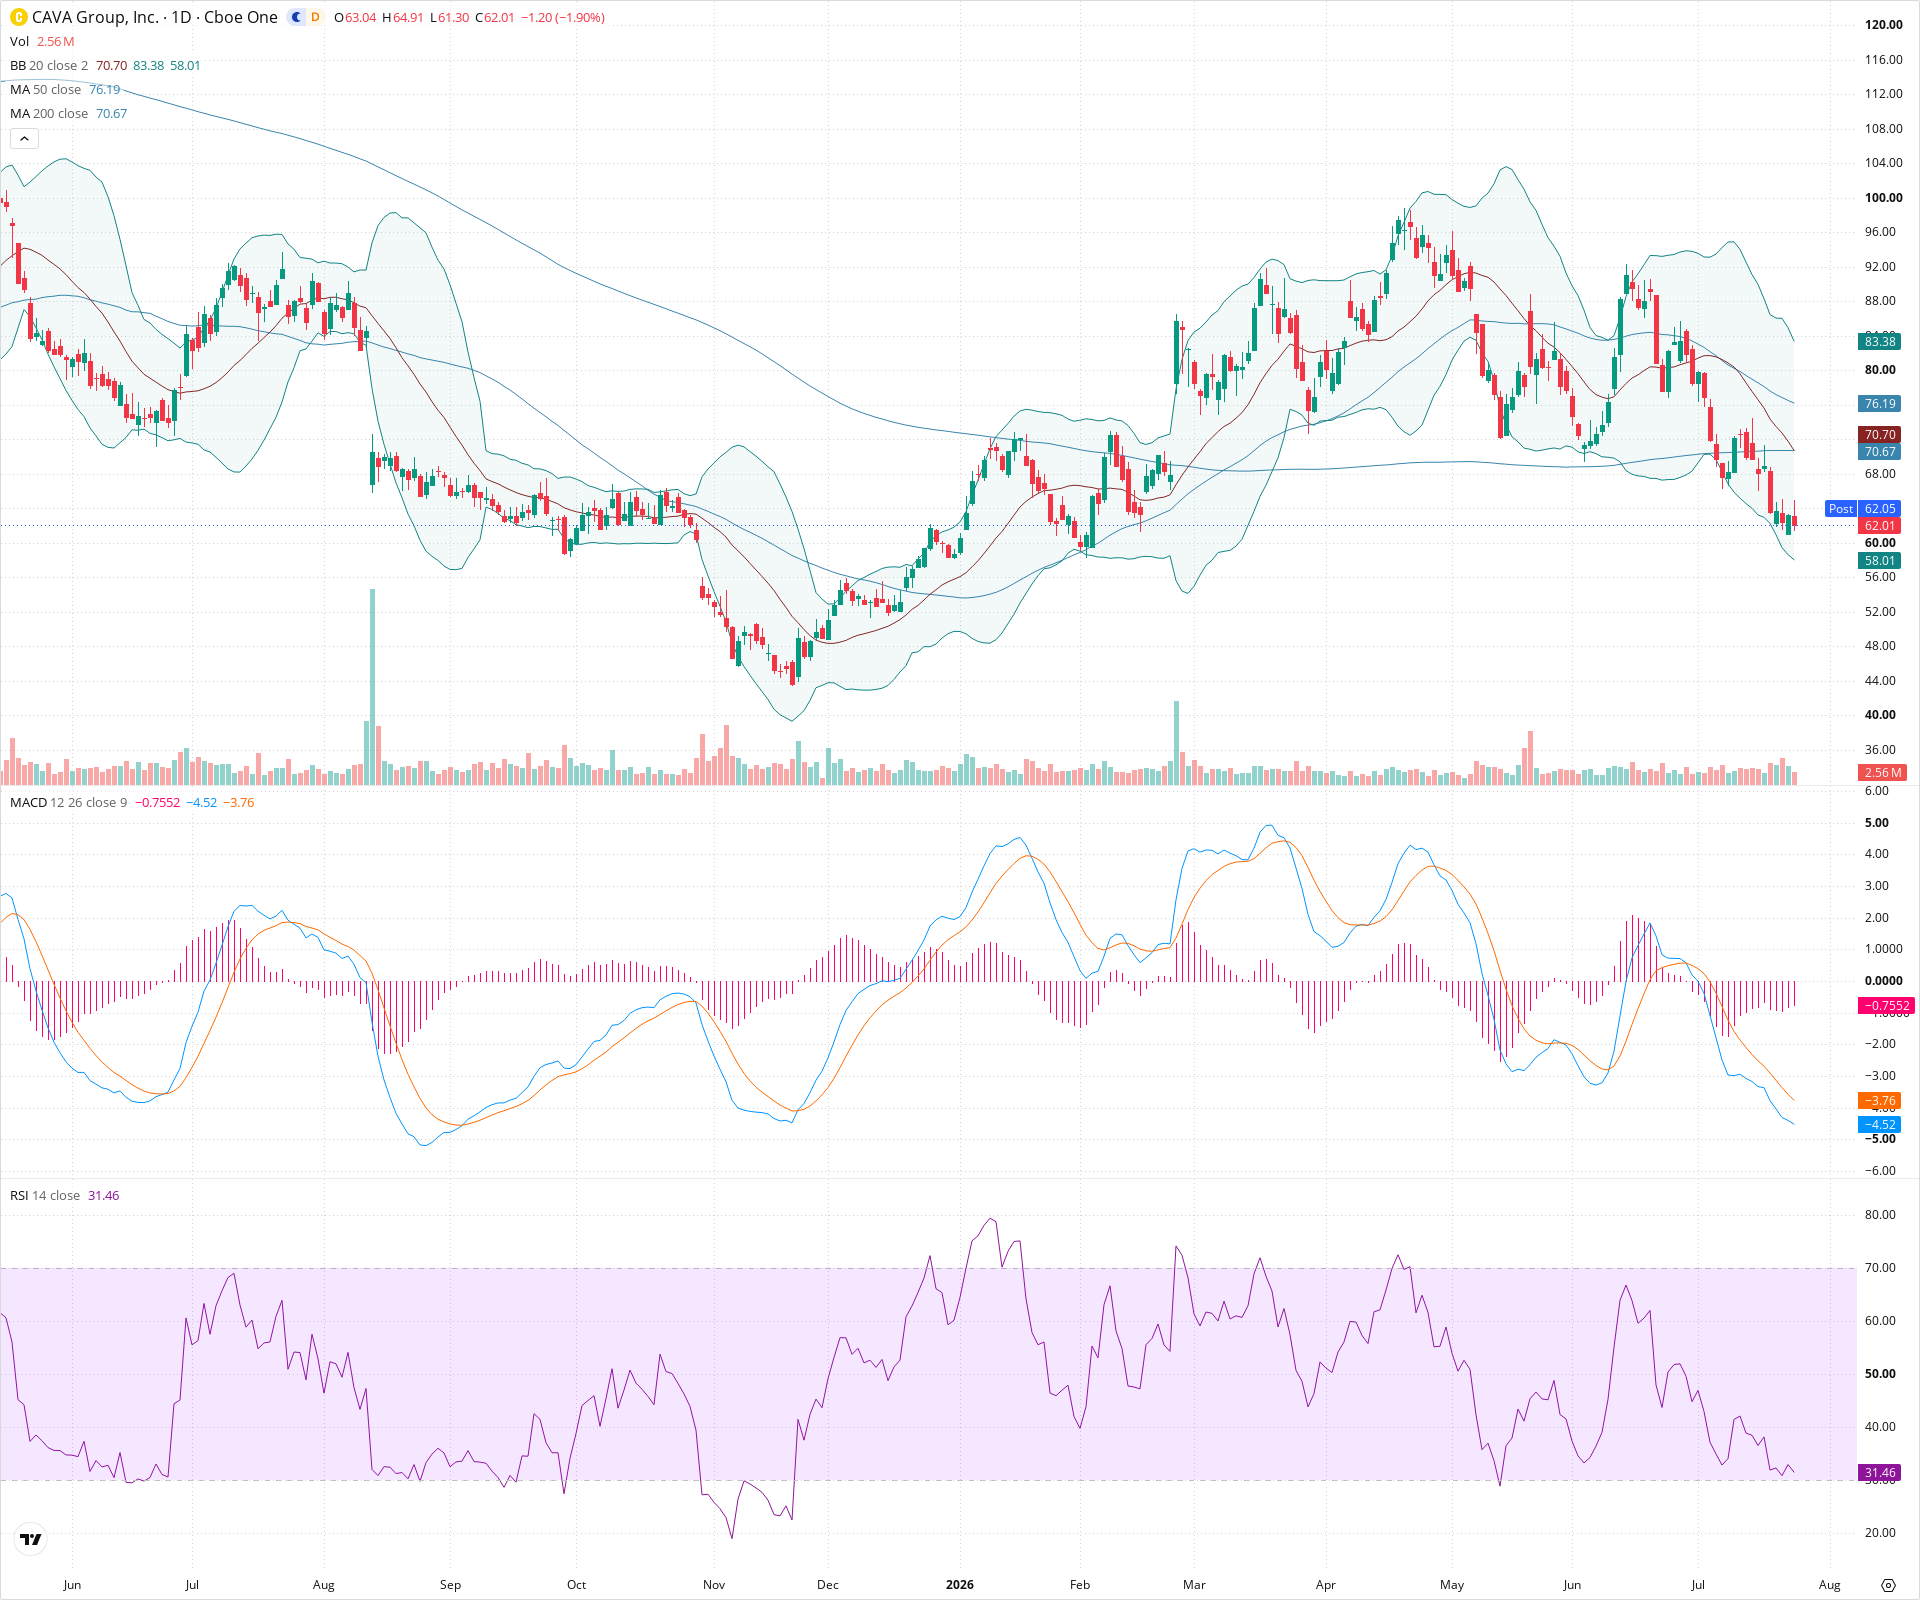
CAVA Daily Chart
Sentiment
Short-term Sentiment (days to weeks): Bearish
Price is in a steep decline, aggressively riding the lower Bollinger Band with expanding volume. MACD is deep in negative territory with an expanding histogram, confirming strong downward momentum. RSI is nearing oversold (31.46) but shows no sign of divergence or reversal yet.
Long-term Sentiment (weeks to months): Bearish
The broader technical structure has broken down significantly. Price has decisively sliced through the 200-day SMA, and the 50-day SMA is rolling over sharply, suggesting a potential structural trend change from bullish to bearish following a large top formation.
Report Metadata
- Timeframe: daily
- Generated at: 2026-07-24T21:11:21.400Z
- Model: gemini-3.1-pro-preview
Support Price Levels
| Level | Range | Strength | Notes |
|---|---|---|---|
| $57.00 | $56.00 - $58.00 | Weak | Minor prior consolidation and bounce zone on the way up. |
| $53.00 | $52.00 - $54.00 | Strong | Significant previous structural swing low and consolidation area. |
Resistance Price Levels
| Level | Range | Strength | Notes |
|---|---|---|---|
| $69.50 | $68.00 - $71.00 | Strong | Recent breakdown level, now coinciding closely with the 200-day SMA (70.67). |
| $76.50 | $75.00 - $78.00 | Strong | Neckline area of the large topping pattern and current location of the declining 50-day SMA (76.19). |
Potential Chart Patterns in Formation
| Strength | Pattern | Signal | Target | Details |
|---|---|---|---|---|
| Strong | Head and Shoulders Top | Bearish | $54.00 | A prominent, large-scale topping pattern with the left shoulder forming around 92-96, head around 104-106, and right shoulder around 92-96. The price has violently broken down through the implied neckline in the high 70s. |
Frequently Asked Questions about CAVA
What is the current sentiment for CAVA?
The short-term sentiment for CAVA is currently Bearish because Price is in a steep decline, aggressively riding the lower Bollinger Band with expanding volume. MACD is deep in negative territory with an expanding histogram, confirming strong downward momentum. RSI is nearing oversold (31.46) but shows no sign of divergence or reversal yet.. The long-term trend is classified as Bearish.
What are the key support levels for CAVA?
StockDips.AI has identified key support levels for CAVA at $57.00 and $53.00. These levels may represent potential accumulation zones where buying interest could emerge.
Is CAVA in a significant dip or a Value Dip right now?
CAVA has a Value Score of 60/100. It is not currently flagged as a significant dip in the Top Dips list. It is not listed as a Value Dip because the long-term sentiment or value-score threshold does not qualify.
View the full interactive analysis on StockDips.AI.