CAVA Weekly Technical Analysis
Cava Group Inc
Fast-casual restaurant chain offering Mediterranean bowls, pitas, and salads.
CAVA Technical Analysis Summary
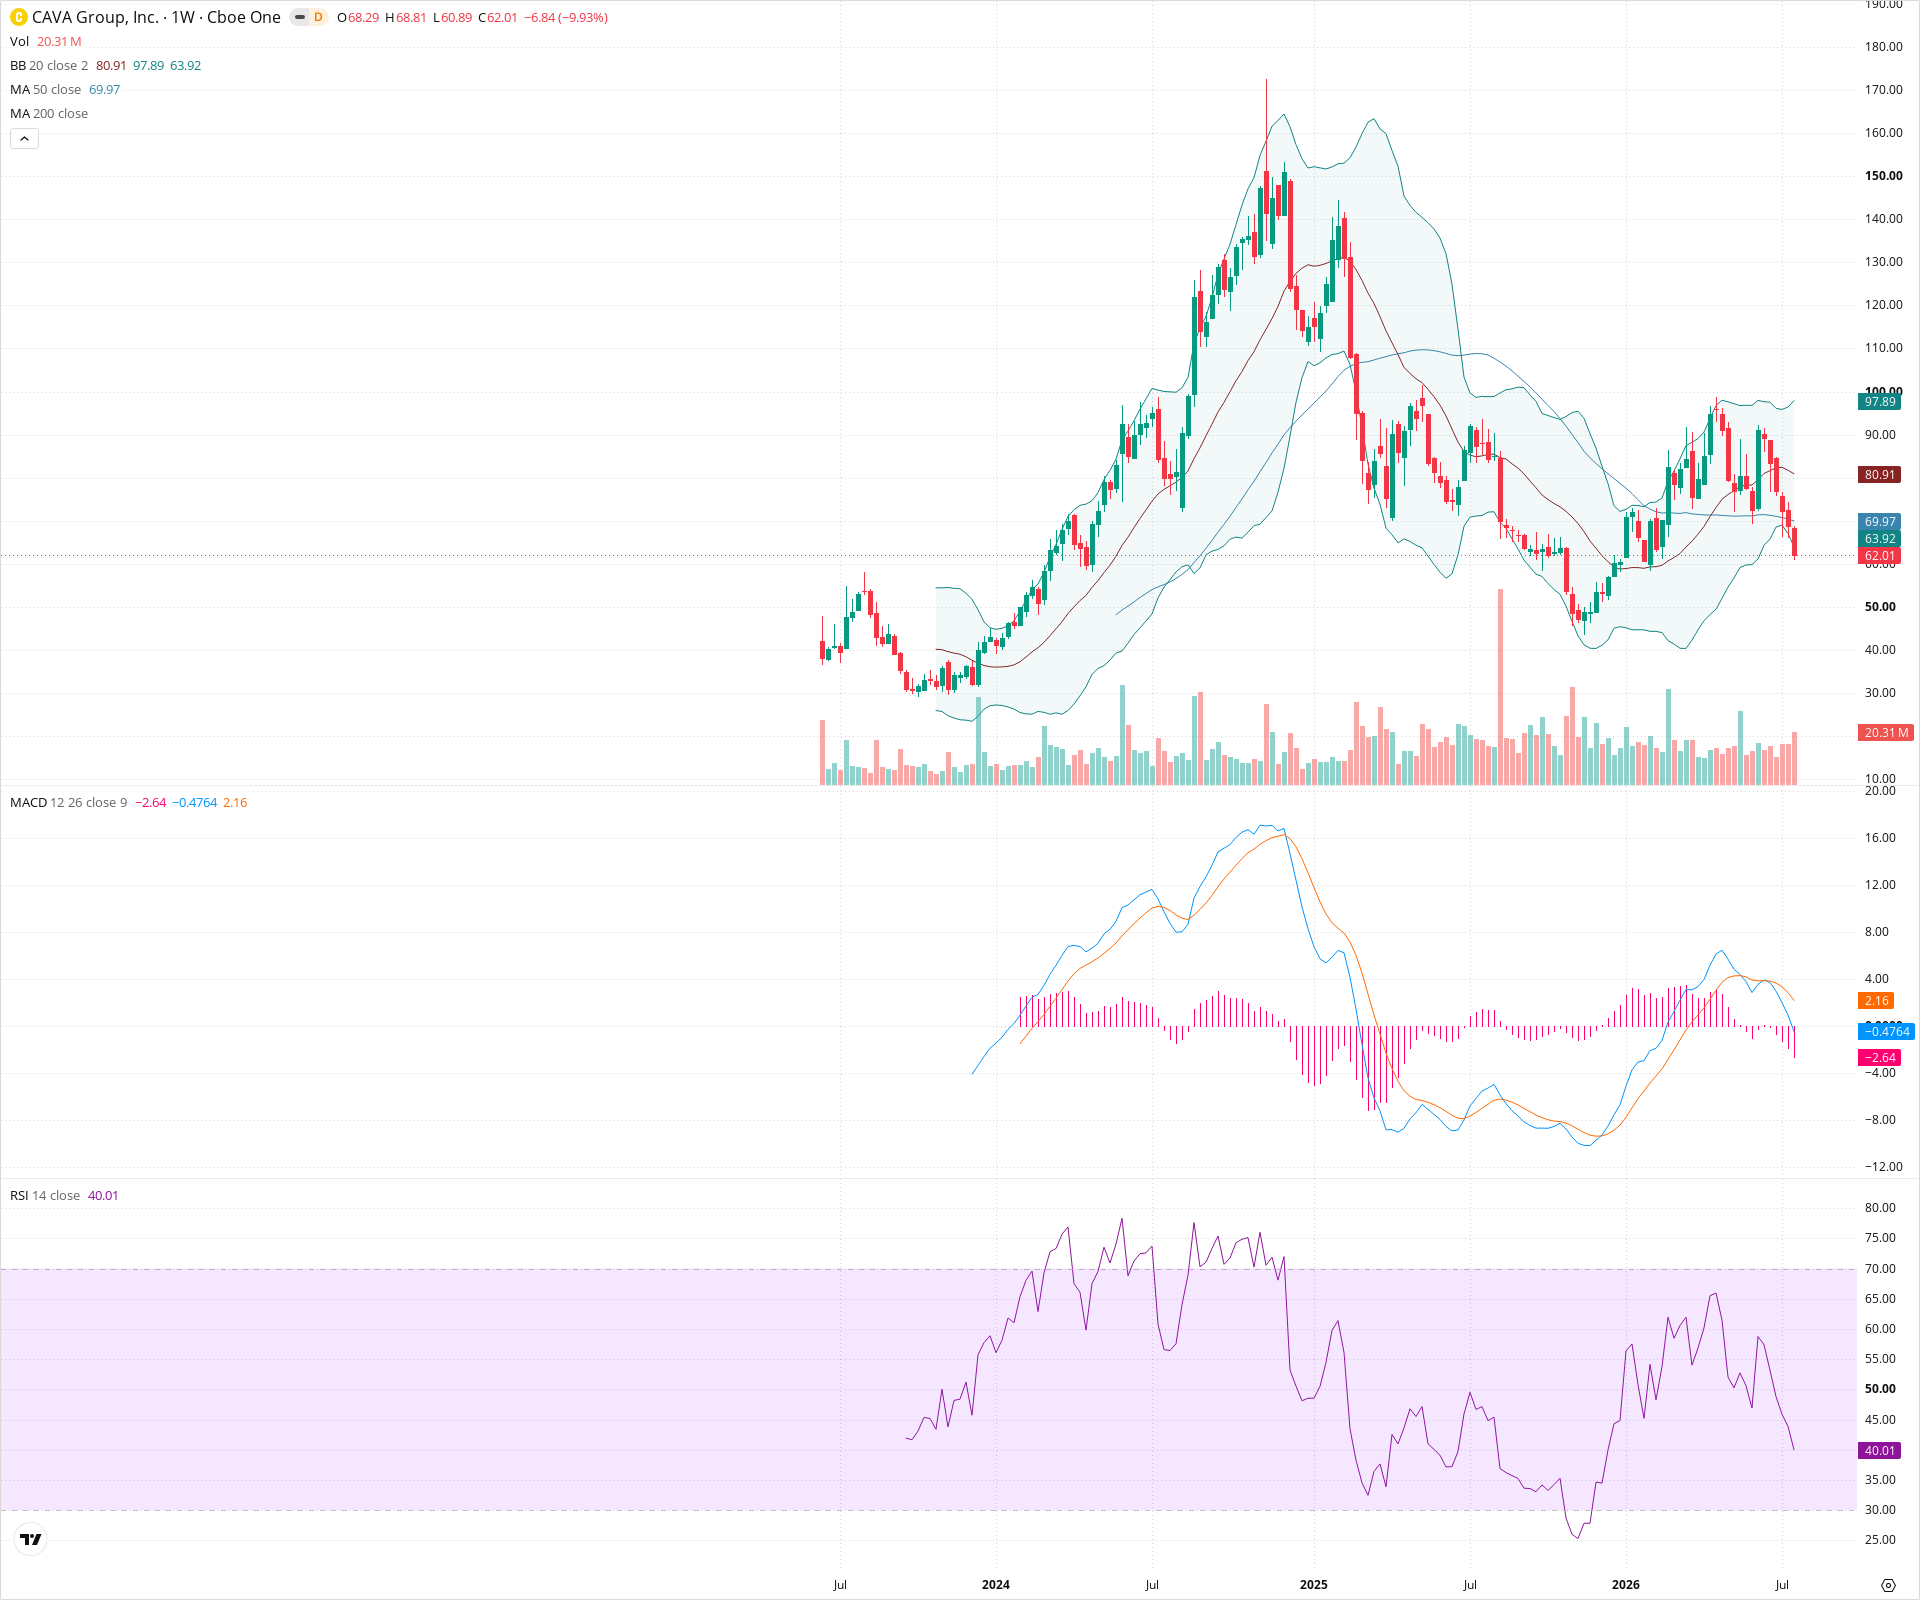
CAVA is currently exhibiting a bearish technical structure on the weekly chart, having formed a major lower high near $100. Short-term momentum is aggressively to the downside following a loss of the 50-week SMA, supported by deteriorating MACD and RSI indicators. The stock is likely to test lower support zones in the $50s, with critical long-term support resting much lower in the $30-$35 range.
Included In Lists
Related Tickers of Interest
CAVA Weekly Chart
Sentiment
Short-term Sentiment (days to weeks): Bearish
Price has decisively broken below the 50-week SMA with a strong bearish candle. Momentum is accelerating downwards, confirmed by a bearish MACD crossover and expanding negative histogram, while RSI is falling steeply towards oversold territory.
Long-term Sentiment (weeks to months): Bearish
The stock has established a clear pattern of lower highs, with the recent rally failing significantly below the all-time high, confirming a macro downtrend structure.
Report Metadata
- Timeframe: weekly
- Generated at: 2026-07-25T09:08:45.599Z
- Model: gemini-3.1-pro-preview
Support Price Levels
| Level | Range | Strength | Notes |
|---|---|---|---|
| $52.50 | $50.00 - $55.00 | Weak | Minor consolidation zone from previous downward price action before the ultimate bottom. |
| $32.50 | $30.00 - $35.00 | Strong | Major macro structural low; the critical level defending the long-term trend. |
Resistance Price Levels
| Level | Range | Strength | Notes |
|---|---|---|---|
| $72.50 | $70.00 - $75.00 | Strong | Previous support zone now acting as resistance, clustered around the 50-week SMA. |
| $100.00 | $95.00 - $105.00 | Strong | Recent major swing high where the rally completely failed, forming a significant lower high. |
Potential Chart Patterns in Formation
| Strength | Pattern | Signal | Target | Details |
|---|---|---|---|---|
| Strong | Macro Lower High | Bearish | N/A | The stock rallied from its deep lows but was heavily rejected near $100, creating a significant structural lower high compared to the $170 peak, confirming seller control on large timeframes. |
Frequently Asked Questions about CAVA
What is the current sentiment for CAVA?
The short-term sentiment for CAVA is currently Bearish because Price has decisively broken below the 50-week SMA with a strong bearish candle. Momentum is accelerating downwards, confirmed by a bearish MACD crossover and expanding negative histogram, while RSI is falling steeply towards oversold territory.. The long-term trend is classified as Bearish.
What are the key support levels for CAVA?
StockDips.AI has identified key support levels for CAVA at $52.50 and $32.50. These levels may represent potential accumulation zones where buying interest could emerge.
Is CAVA in a significant dip or a Value Dip right now?
CAVA has a Value Score of 60/100. It is not currently flagged as a significant dip in the Top Dips list. It is not listed as a Value Dip because the long-term sentiment or value-score threshold does not qualify.
View the full interactive analysis on StockDips.AI.