CIFR Weekly Technical Analysis
Cipher Mining Inc
U.S. Bitcoin mining company operating large-scale data centers.
CIFR Technical Analysis Summary
CIFR is exhibiting a powerful long-term technical profile, having successfully broken out from a massive multi-year base. The weekly moving averages are in full bullish alignment, and strong volume continues to support upside price action. While short-term pullbacks are expected after sharp rallies, structural support levels below suggest the primary trend remains decisively upward for long-term investors.
Included In Lists
Related Tickers of Interest
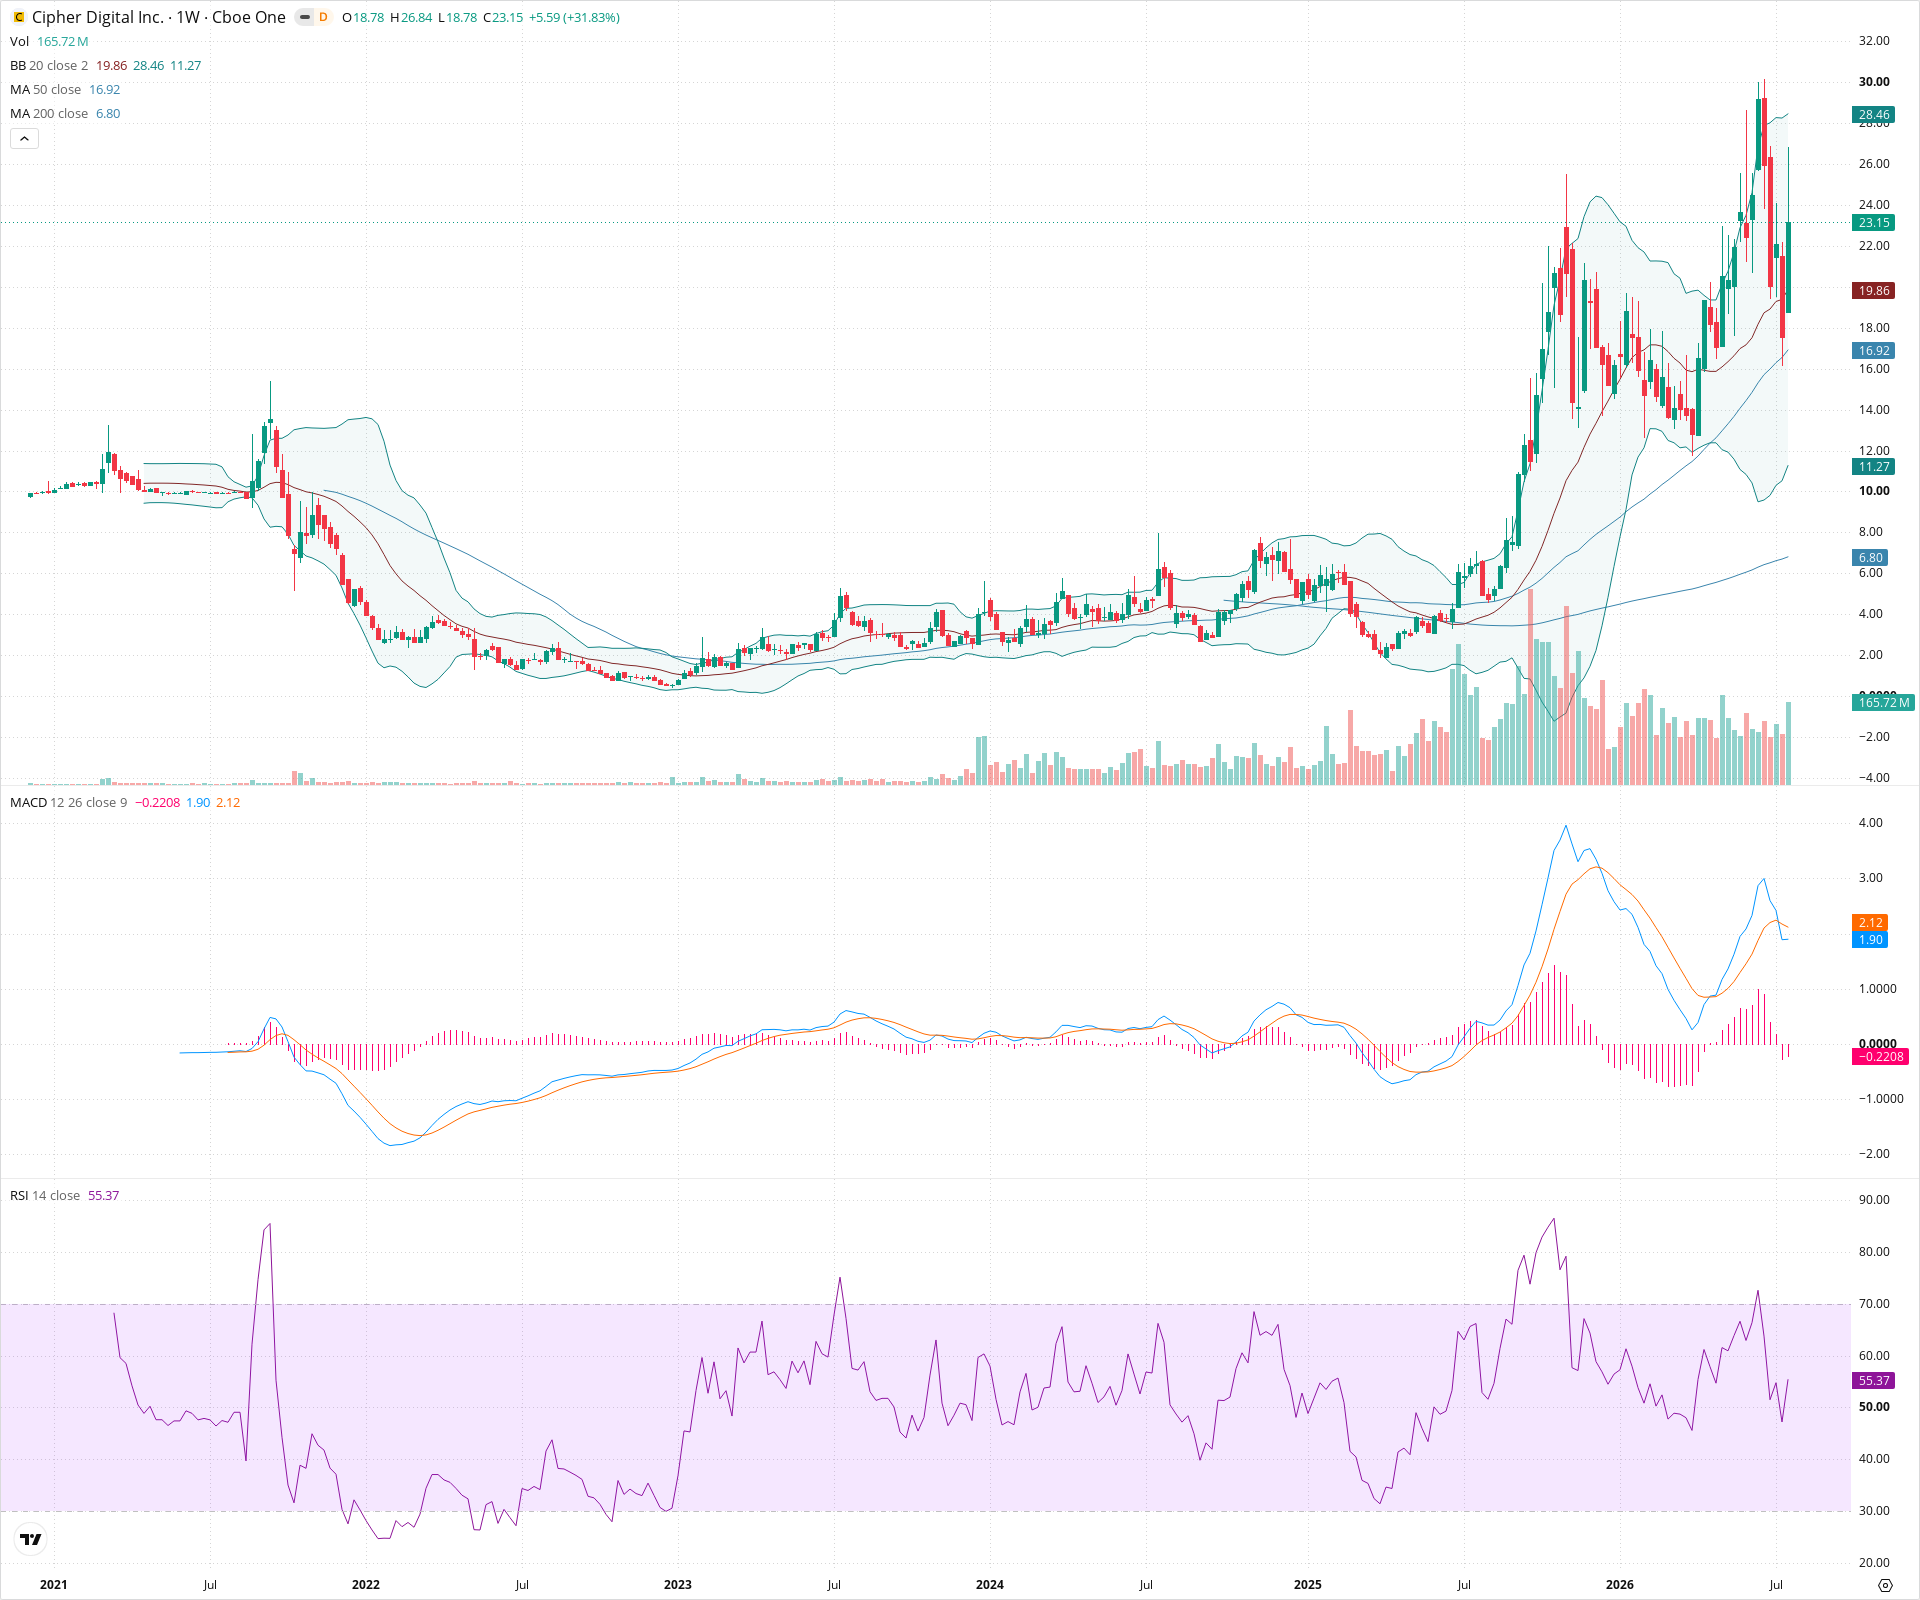
CIFR Weekly Chart
Sentiment
Short-term Sentiment (days to weeks): Bullish
Price is in a strong short-term uptrend, holding well above the rising 20-week SMA. Recent volume expansion supports the upward momentum, although a minor pullback is currently visible after tagging the upper Bollinger Band.
Long-term Sentiment (weeks to months): Bullish
The long-term chart shows a massive base breakout and a firmly established sequence of higher highs and higher lows. The 50-week SMA has crossed above the 200-week SMA, providing a strong long-term bullish alignment.
Report Metadata
- Timeframe: weekly
- Generated at: 2026-07-25T09:07:44.898Z
- Model: gemini-3.1-pro-preview
Support Price Levels
| Level | Range | Strength | Notes |
|---|---|---|---|
| $19.50 | $19.00 - $20.00 | Weak | Immediate dynamic support zone near the rising 20-week SMA (19.86). |
| $16.75 | $16.00 - $17.50 | Strong | Major structural support zone. This area acted as prior resistance and now aligns with the rising 50-week SMA. |
| $11.00 | $10.00 - $12.00 | Strong | Deep structural support based on prior multi-month consolidation before the recent major leg up. |
Resistance Price Levels
| Level | Range | Strength | Notes |
|---|---|---|---|
| $27.50 | $26.50 - $28.50 | Strong | Recent swing high area and the upper boundary of the current Bollinger Band. |
| $31.00 | $30.00 - $32.00 | Strong | Historical resistance zone from the initial peak on the far left of the chart. |
Potential Chart Patterns in Formation
| Strength | Pattern | Signal | Target | Details |
|---|---|---|---|---|
| Strong | Rounding Bottom Breakout | Bullish | N/A | The chart exhibits a multi-year rounded bottoming process, culminating in a significant breakout above the ~16 level, indicating a major long-term trend reversal. |
| Strong | Established Uptrend | Bullish | N/A | A clear pattern of higher highs and higher lows has formed since the bottoming phase, defining a strong and ongoing bullish trend channel. |
Frequently Asked Questions about CIFR
What is the current sentiment for CIFR?
The short-term sentiment for CIFR is currently Bullish because Price is in a strong short-term uptrend, holding well above the rising 20-week SMA. Recent volume expansion supports the upward momentum, although a minor pullback is currently visible after tagging the upper Bollinger Band.. The long-term trend is classified as Bullish.
What are the key support levels for CIFR?
StockDips.AI has identified key support levels for CIFR at $19.50 and $16.75. These levels may represent potential accumulation zones where buying interest could emerge.
Is CIFR in a significant dip or a Value Dip right now?
CIFR has a Value Score of 59/100. It is not currently flagged as a significant dip in the Top Dips list. It is not listed as a Value Dip because the long-term sentiment or value-score threshold does not qualify.
View the full interactive analysis on StockDips.AI.