CMG Weekly Technical Analysis
Chipotle Mexican Grill
Fast-casual restaurant chain serving customizable Mexican-inspired meals.
CMG Technical Analysis Summary
CMG is currently in a severe, established long-term downtrend, trading well below all key weekly moving averages. While momentum indicators like the MACD show slight signs of deceleration in the selling pressure, the price action itself remains weak, frequently being rejected at lower highs. Until the stock can structurally reclaim levels above the 50-week SMA and break the pattern of lower highs, the broader technical outlook remains firmly bearish.
Included In Lists
Related Tickers of Interest
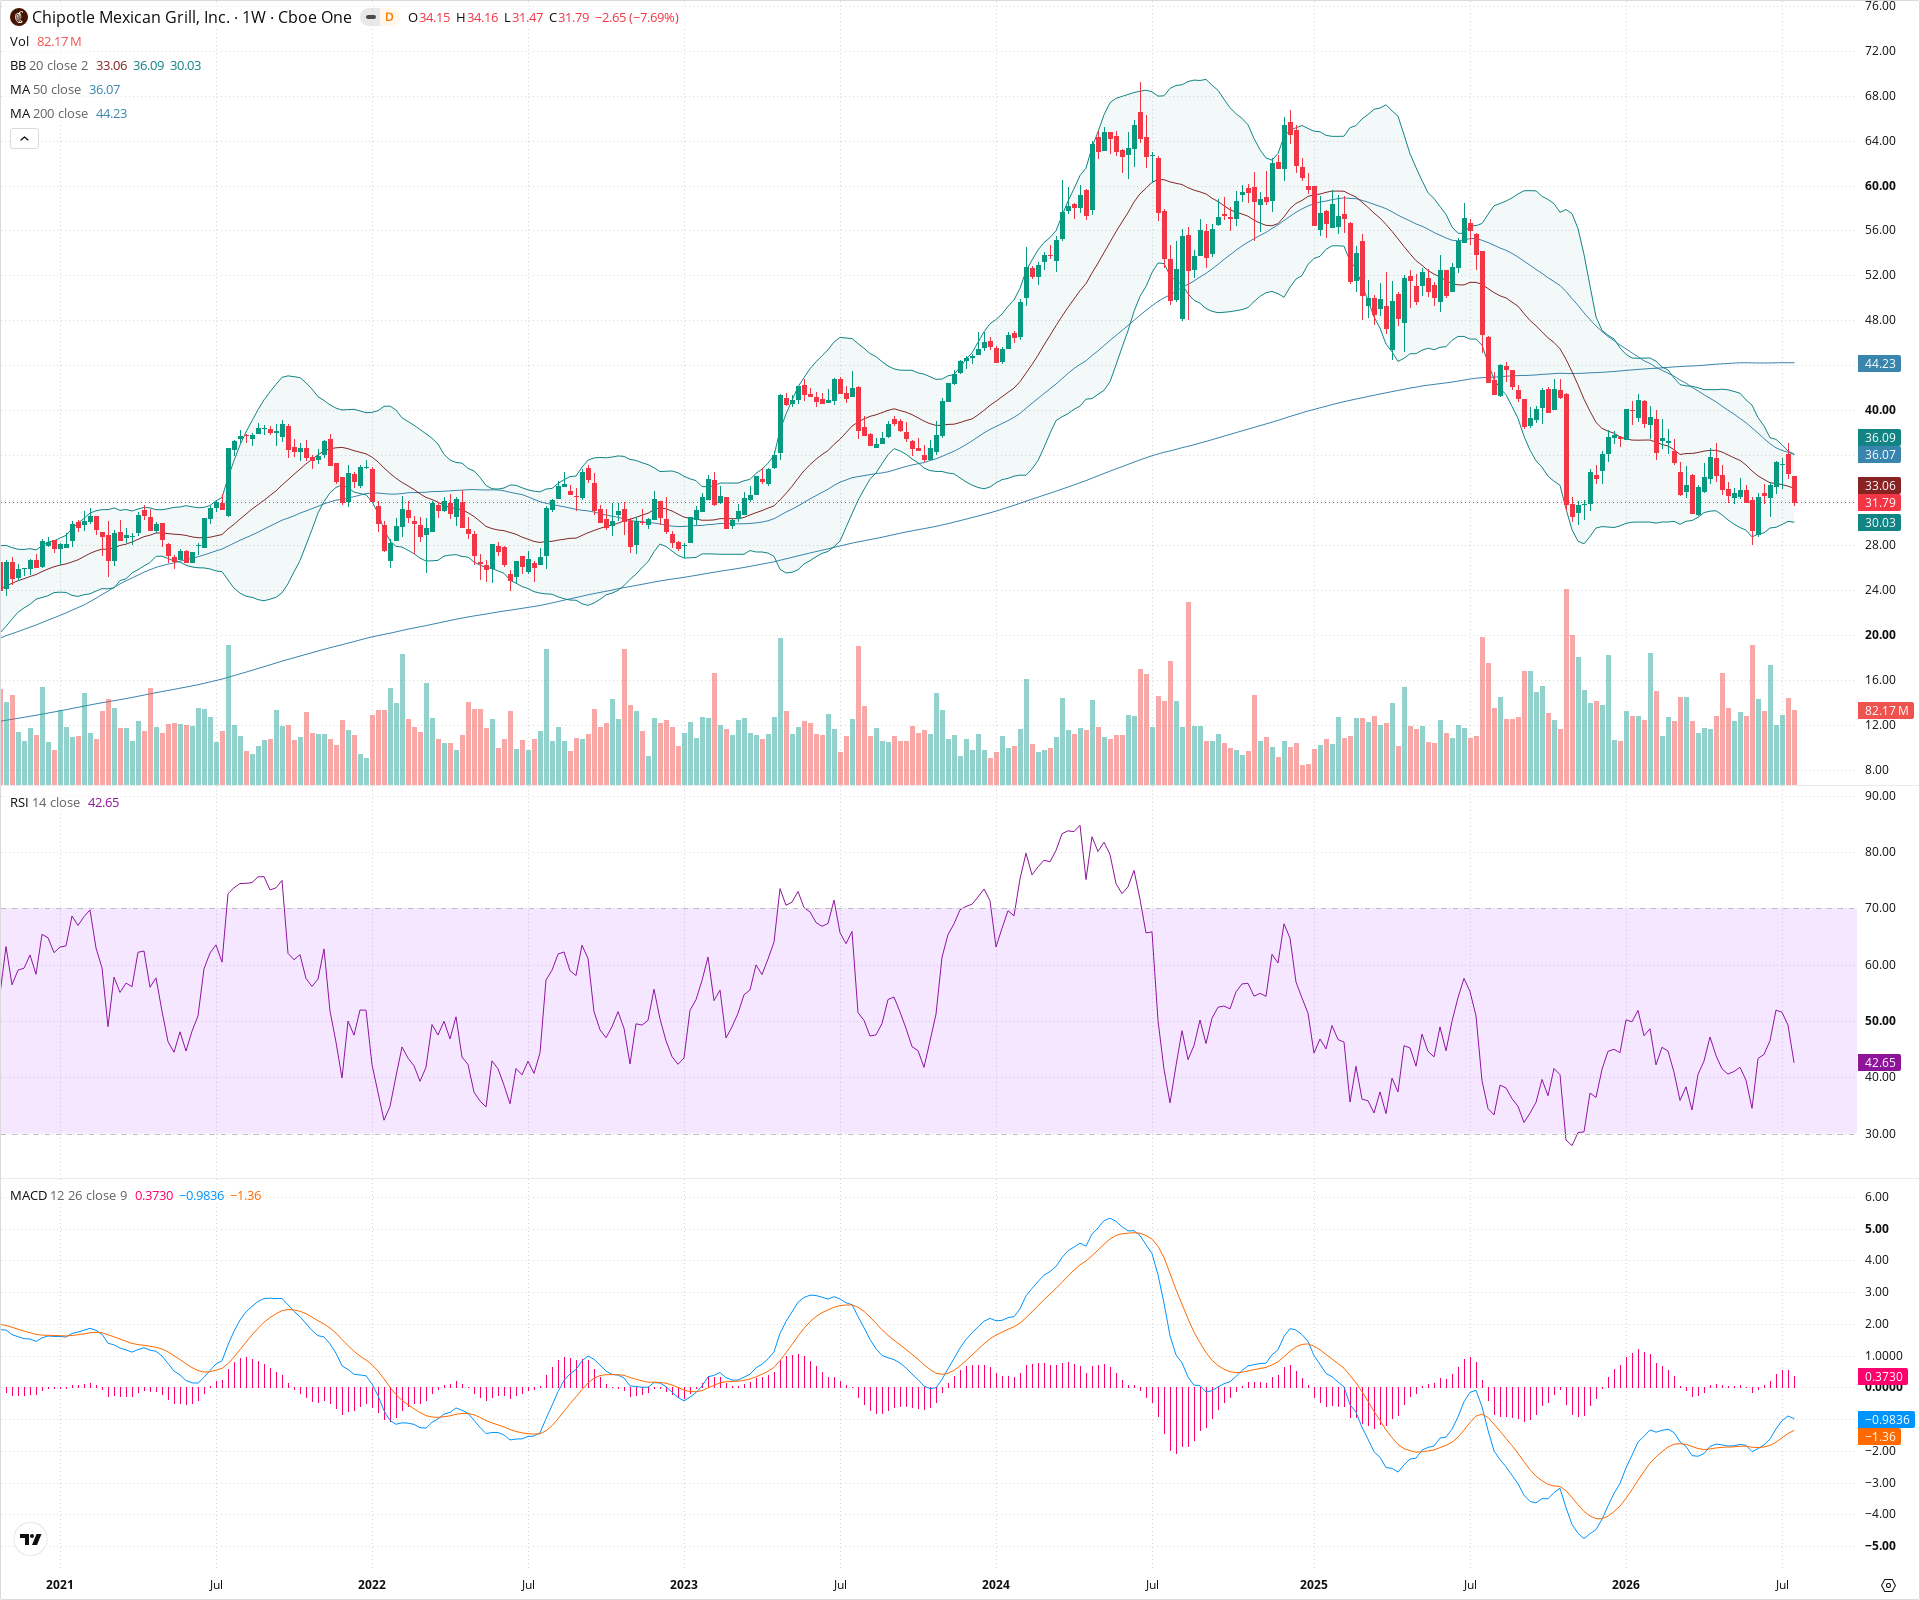
CMG Weekly Chart
Sentiment
Short-term Sentiment (days to weeks): Bearish
Price remains suppressed below the 20-week and 50-week SMAs. Despite a recent MACD bullish crossover deep in negative territory, the current week shows a strong bearish candle, indicating ongoing selling pressure.
Long-term Sentiment (weeks to months): Bearish
The stock is entrenched in a massive multi-year downtrend, characterized by a consistent sequence of lower highs and lower lows. It is trading significantly below a sharply declining 200-week SMA, with the 50-week SMA acting as dynamic resistance.
Report Metadata
- Timeframe: weekly
- Generated at: 2026-07-25T09:14:01.001Z
- Model: gemini-3.1-pro-preview
Support Price Levels
| Level | Range | Strength | Notes |
|---|---|---|---|
| $29.00 | $28.00 - $30.00 | Strong | Recent swing low consolidation area and proximity to the lower Bollinger Band. |
| $25.00 | $24.00 - $26.00 | Weak | Historical consolidation zone visible on the far left of the chart. |
Resistance Price Levels
| Level | Range | Strength | Notes |
|---|---|---|---|
| $37.00 | $36.00 - $38.00 | Strong | Confluence of recent structural resistance (lower highs) and the declining 50-week SMA. |
| $45.00 | $44.00 - $46.00 | Strong | Major previous breakdown level and proximity to the declining 200-week SMA. |
Potential Chart Patterns in Formation
| Strength | Pattern | Signal | Target | Details |
|---|---|---|---|---|
| Strong | Sustained Macro Downtrend | Bearish | N/A | A prolonged, multi-year sequence of lower highs and lower lows following a massive topping structure, with price firmly rejected at major moving averages during counter-trend bounces. |
Frequently Asked Questions about CMG
What is the current sentiment for CMG?
The short-term sentiment for CMG is currently Bearish because Price remains suppressed below the 20-week and 50-week SMAs. Despite a recent MACD bullish crossover deep in negative territory, the current week shows a strong bearish candle, indicating ongoing selling pressure.. The long-term trend is classified as Bearish.
What are the key support levels for CMG?
StockDips.AI has identified key support levels for CMG at $29.00 and $25.00. These levels may represent potential accumulation zones where buying interest could emerge.
Is CMG in a significant dip or a Value Dip right now?
CMG has a Value Score of 49/100. It is not currently flagged as a significant dip in the Top Dips list. It is not listed as a Value Dip because the long-term sentiment or value-score threshold does not qualify.
View the full interactive analysis on StockDips.AI.