CORZ Daily Technical Analysis
Core Scientific Inc
Major U.S. Bitcoin miner providing hosting and self-mining services.
CORZ Technical Analysis Summary
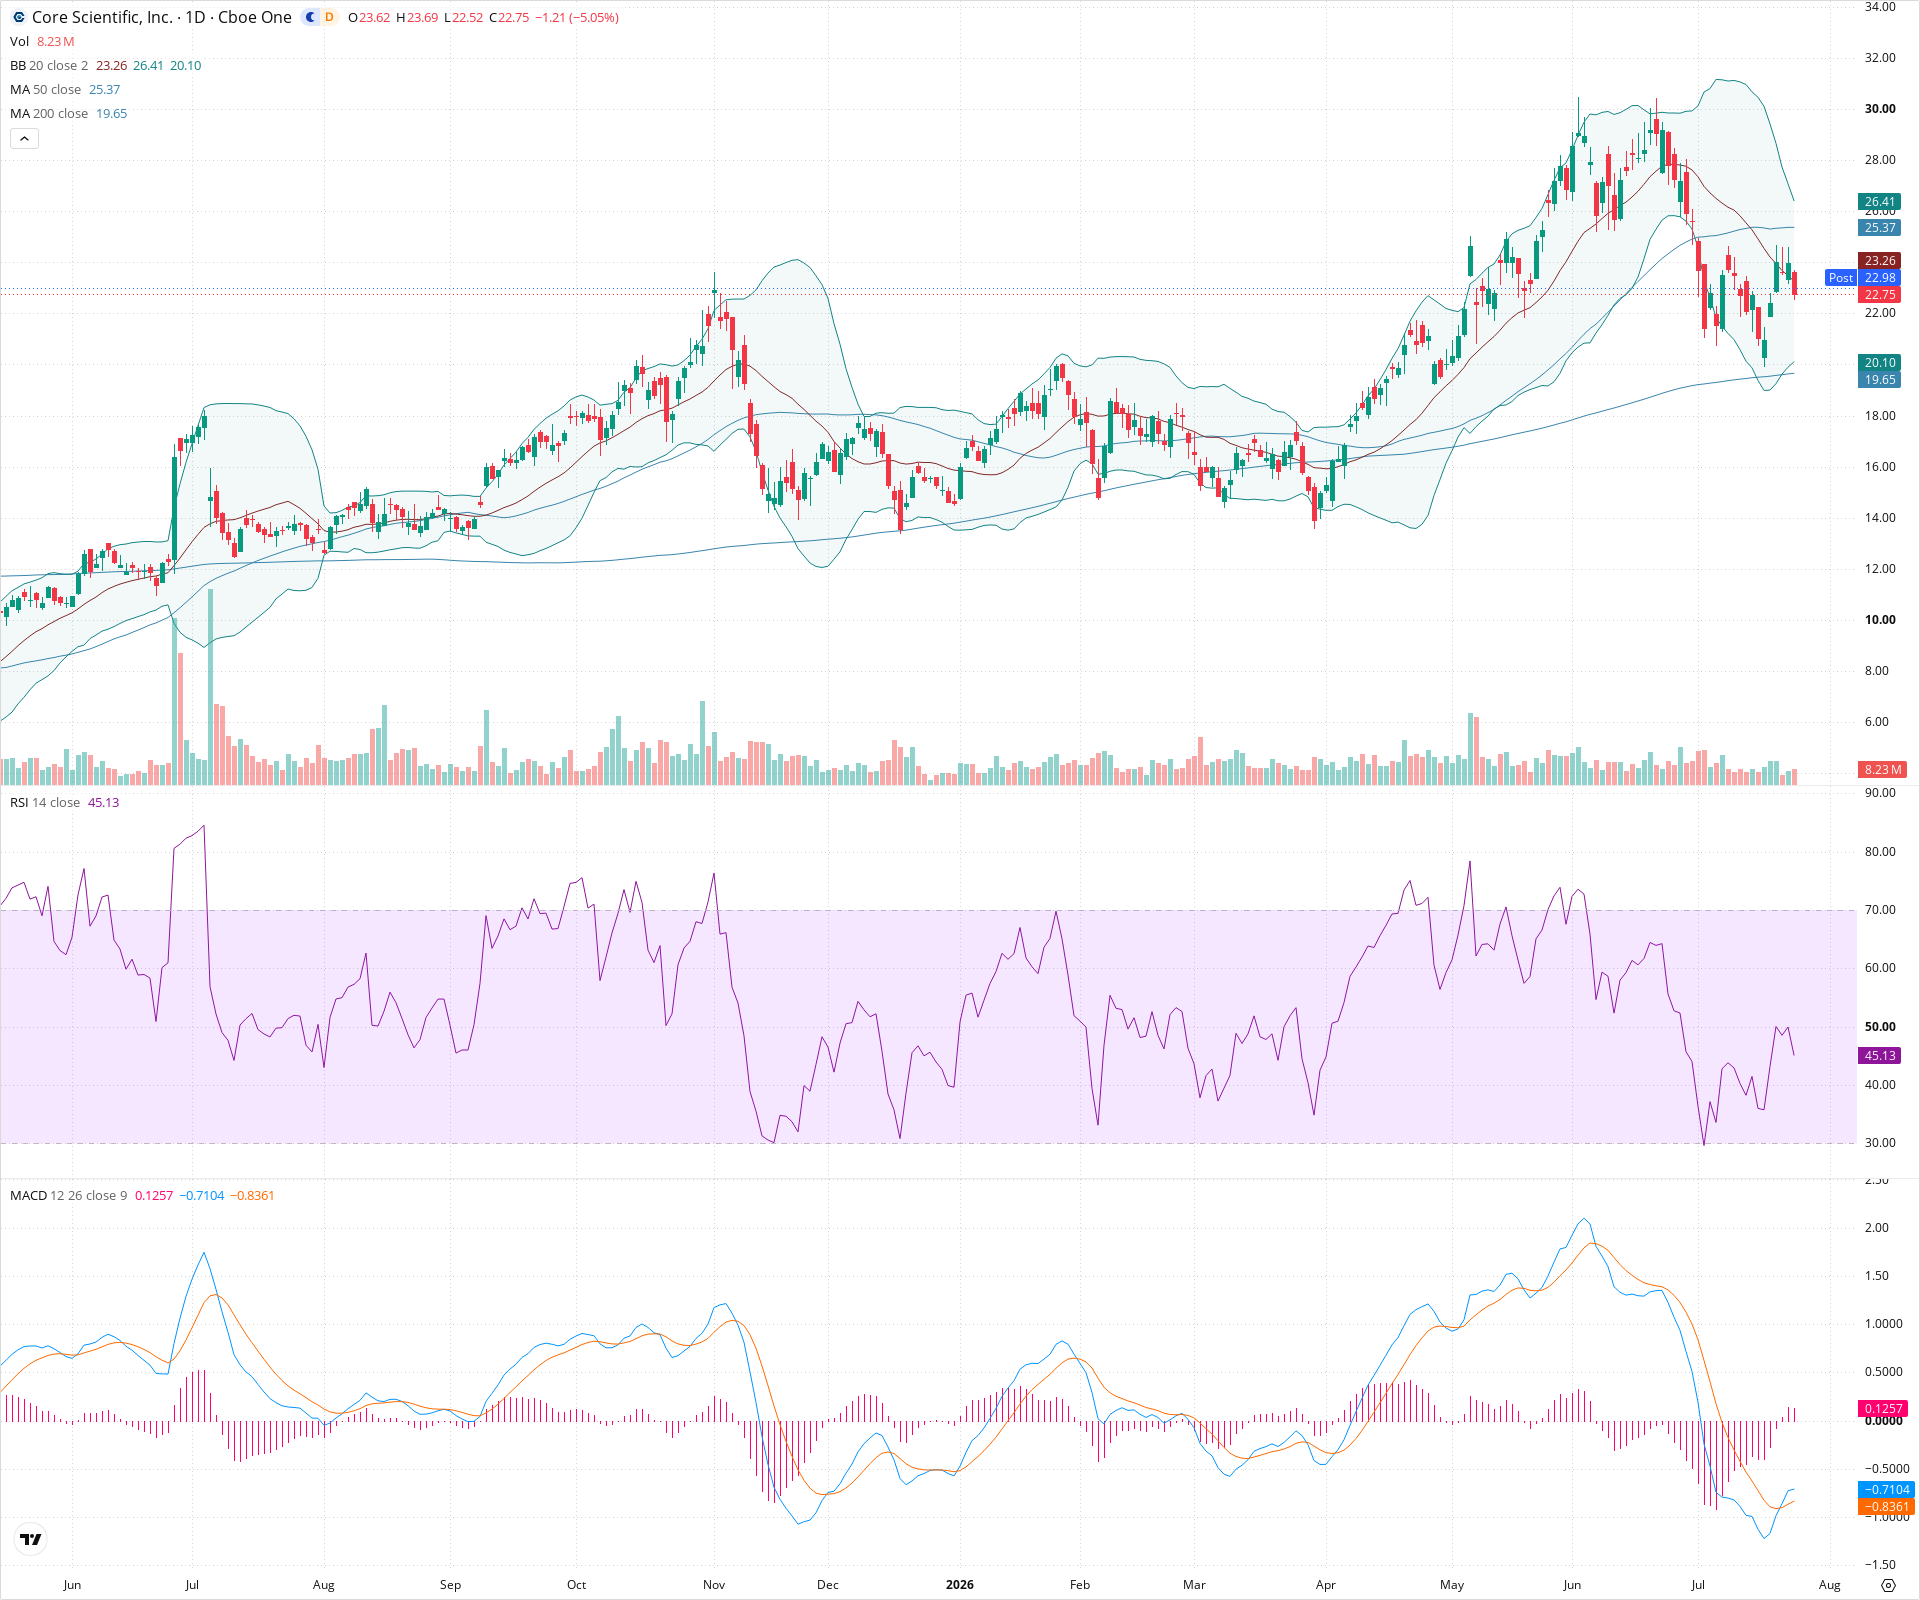
CORZ is currently undergoing a significant short-term correction within the context of a broader, established long-term uptrend. The stock has broken below key near-term moving averages, and momentum indicators suggest the bears currently hold control. Longer-term investors should monitor the critical support zones near $20 and the 200-day SMA to see if buyers step in to defend the primary trend.
Included In Lists
Related Tickers of Interest
CORZ Daily Chart
Sentiment
Short-term Sentiment (days to weeks): Bearish
Price is trading below both the 20-day and 50-day SMAs, forming a series of lower highs and lower lows from the recent peak. RSI is below 50, and the MACD line remains below the signal line with a negative histogram, confirming downward momentum.
Long-term Sentiment (weeks to months): Bullish
The 50-day SMA remains positioned significantly above a rising 200-day SMA, indicating the primary long-term trend is still upward despite the current sharp correction.
Report Metadata
- Timeframe: daily
- Generated at: 2026-07-24T21:15:07.698Z
- Model: gemini-3.1-pro-preview
Support Price Levels
| Level | Range | Strength | Notes |
|---|---|---|---|
| $20.50 | $20.00 - $21.00 | Strong | Previous consolidation zone and structural swing low before the recent major run-up, roughly aligning with the lower Bollinger Band. |
| $19.55 | $19.30 - $19.80 | Strong | Critical long-term dynamic support area provided by the 200-day SMA. |
Resistance Price Levels
| Level | Range | Strength | Notes |
|---|---|---|---|
| $23.55 | $23.30 - $23.80 | Moderate | Immediate resistance at the recently broken 20-day SMA (middle Bollinger Band). |
| $25.50 | $25.20 - $25.80 | Strong | Significant resistance zone marked by the 50-day SMA and prior support/resistance flips during the descent. |
Potential Chart Patterns in Formation
| Strength | Pattern | Signal | Target | Details |
|---|---|---|---|---|
| Strong | Descending Channel / Downtrend | Bearish | N/A | Price action since the peak near 30 has established a clear pattern of lower highs and lower lows, defining a short-term bearish trend channel. |
Frequently Asked Questions about CORZ
What is the current sentiment for CORZ?
The short-term sentiment for CORZ is currently Bearish because Price is trading below both the 20-day and 50-day SMAs, forming a series of lower highs and lower lows from the recent peak. RSI is below 50, and the MACD line remains below the signal line with a negative histogram, confirming downward momentum.. The long-term trend is classified as Bullish.
What are the key support levels for CORZ?
StockDips.AI has identified key support levels for CORZ at $20.50 and $19.55. These levels may represent potential accumulation zones where buying interest could emerge.
Is CORZ in a significant dip or a Value Dip right now?
CORZ has a Value Score of 26/100. It is not currently flagged as a significant dip in the Top Dips list. It is not listed as a Value Dip because the long-term sentiment or value-score threshold does not qualify.
View the full interactive analysis on StockDips.AI.