CORZ Weekly Technical Analysis
Core Scientific Inc
Major U.S. Bitcoin miner providing hosting and self-mining services.
CORZ Technical Analysis Summary
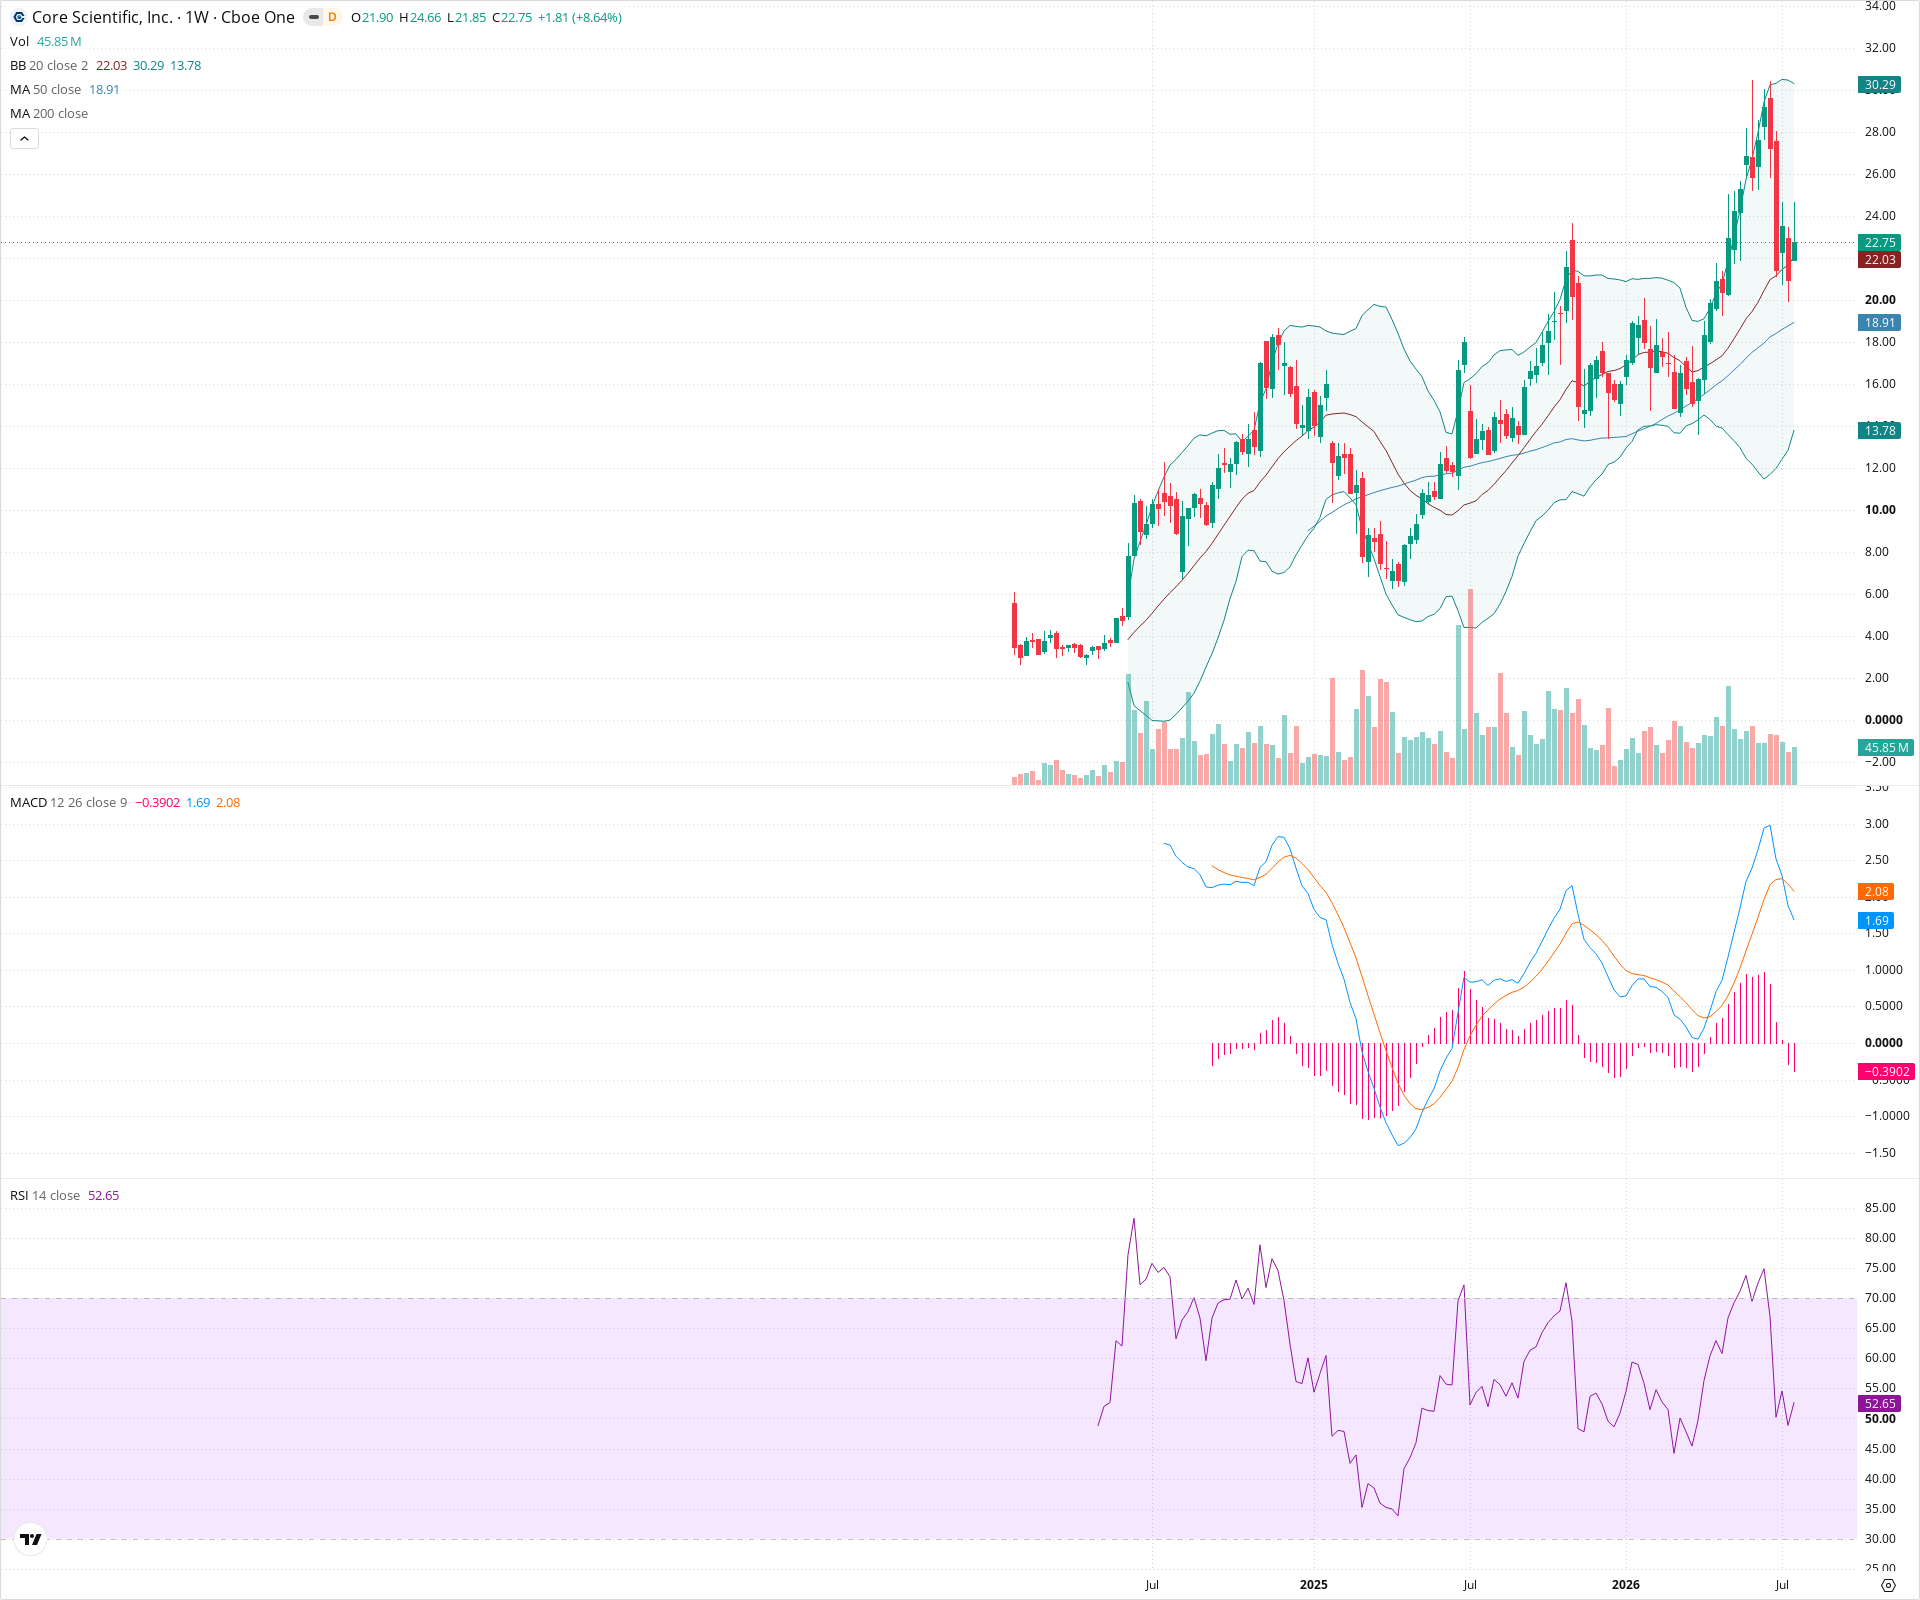
CORZ is in a powerful, long-term weekly uptrend characterized by consistent higher highs and higher lows. The stock has recently pulled back from an all-time high near 30-31, and short-term momentum indicators like MACD and RSI suggest a cooling off period or consolidation is underway. However, as long as price holds above the critical support zone near 18-19 (confluence with the 50-week SMA), the primary long-term bullish trend remains fully intact.
Included In Lists
Related Tickers of Interest
CORZ Weekly Chart
Sentiment
Short-term Sentiment (days to weeks): Bullish
Price remains in a strong multi-month uptrend, holding well above the 50-week SMA despite a recent pullback. However, MACD is crossing bearishly and RSI has cooled off, suggesting short-term consolidation or momentum loss.
Long-term Sentiment (weeks to months): Bullish
The long-term chart shows a powerful sustained uptrend with price consistently making higher highs and higher lows. All moving averages are trending upwards, indicating strong underlying long-term bullish momentum.
Report Metadata
- Timeframe: weekly
- Generated at: 2026-07-25T09:08:49.834Z
- Model: gemini-3.1-pro-preview
Support Price Levels
| Level | Range | Strength | Notes |
|---|---|---|---|
| $18.50 | $18.00 - $19.00 | Strong | Confluence of a major structural swing low from mid-2025 and the rising 50-week SMA, providing critical underlying support. |
| $13.75 | $13.00 - $14.50 | Strong | A massive historical consolidation zone and major swing low area formed in late 2024/early 2025. |
Resistance Price Levels
| Level | Range | Strength | Notes |
|---|---|---|---|
| $30.50 | $30.00 - $31.00 | Strong | The all-time high / major structural peak reached recently before the current pullback. |
| $34.50 | $34.00 - $35.00 | Weak | Psychological resistance level beyond the current all-time highs. |
Potential Chart Patterns in Formation
| Strength | Pattern | Signal | Target | Details |
|---|---|---|---|---|
| Strong | Uptrend / Higher Highs and Higher Lows | Bullish | N/A | The chart displays a classic and sustained sequence of higher highs and higher lows extending back over a year. |
| Weak | Pullback / Flag Formation | Neutral | N/A | Price is currently pulling back from recent highs in what appears to be a healthy correction or flag formation within the larger uptrend. |
Frequently Asked Questions about CORZ
What is the current sentiment for CORZ?
The short-term sentiment for CORZ is currently Bullish because Price remains in a strong multi-month uptrend, holding well above the 50-week SMA despite a recent pullback. However, MACD is crossing bearishly and RSI has cooled off, suggesting short-term consolidation or momentum loss.. The long-term trend is classified as Bullish.
What are the key support levels for CORZ?
StockDips.AI has identified key support levels for CORZ at $18.50 and $13.75. These levels may represent potential accumulation zones where buying interest could emerge.
Is CORZ in a significant dip or a Value Dip right now?
CORZ has a Value Score of 26/100. It is not currently flagged as a significant dip in the Top Dips list. It is not listed as a Value Dip because the long-term sentiment or value-score threshold does not qualify.
View the full interactive analysis on StockDips.AI.