COST Weekly Technical Analysis
Costco Wholesale Corp
Membership-based retailer offering bulk goods with strong customer loyalty.
COST Technical Analysis Summary
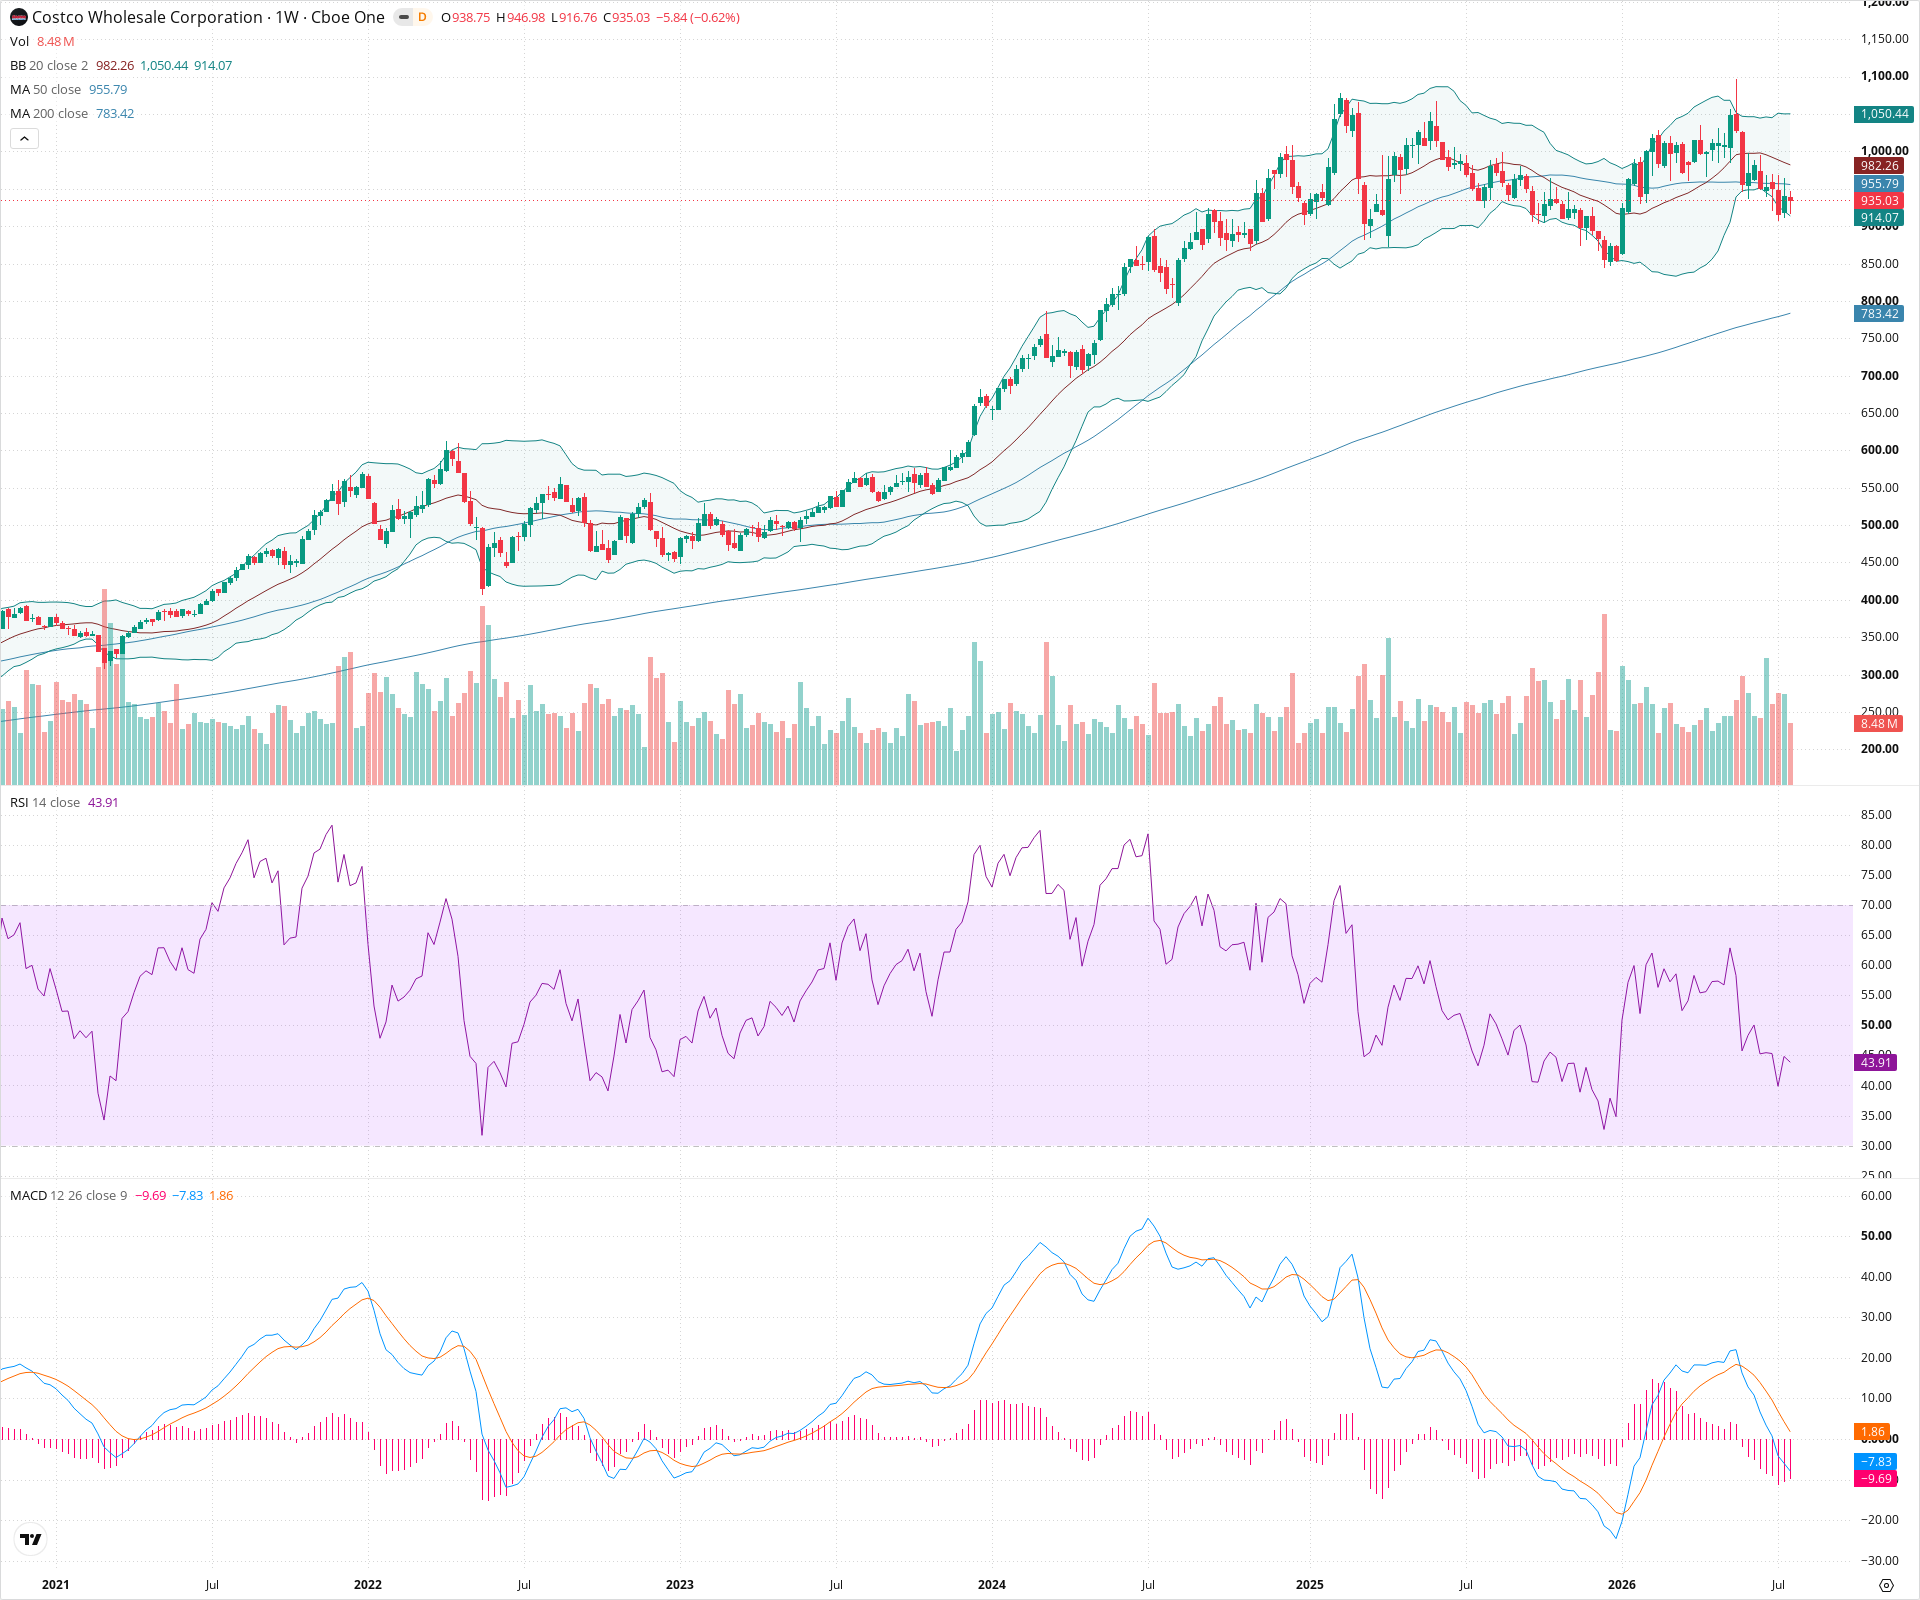
COST has suffered a major technical breakdown on the weekly timeframe, falling sharply from its highs and breaching its 50-week SMA support. The trend is currently defined by lower highs and lower lows, accompanied by bearish momentum indicators (MACD and RSI). The critical test for long-term investors will be whether the price can find a bottom near the rising 200-week SMA, or if further structural damage occurs.
Included In Lists
Related Tickers of Interest
COST Weekly Chart
Sentiment
Short-term Sentiment (days to weeks): Bearish
Price is trading below both the 20-week and 50-week SMAs, establishing a pattern of lower highs and lower lows. MACD is deep in negative territory and RSI is below 50, indicating sustained downward momentum.
Long-term Sentiment (weeks to months): Neutral
While the intermediate trend is broken, the 200-week SMA is still rising and has not yet been tested. The long-term bull trend is paused and in a significant corrective phase, pending interaction with major long-term support.
Report Metadata
- Timeframe: weekly
- Generated at: 2026-07-25T09:03:59.598Z
- Model: gemini-3.1-pro-preview
Support Price Levels
| Level | Range | Strength | Notes |
|---|---|---|---|
| $835.00 | $820.00 - $850.00 | Strong | Recent weekly swing low and significant pivot point from previous price action. |
| $785.00 | $770.00 - $800.00 | Strong | Confluence of previous consolidation zones and the rising 200-week SMA. |
Resistance Price Levels
| Level | Range | Strength | Notes |
|---|---|---|---|
| $967.50 | $950.00 - $985.00 | Strong | Current location of the declining 20-week SMA and the 50-week SMA, which recently acted as resistance on a bounce attempt. |
| $1,075.00 | $1,050.00 - $1,100.00 | Strong | Major recent swing high forming a lower peak after the all-time highs. |
Potential Chart Patterns in Formation
| Strength | Pattern | Signal | Target | Details |
|---|---|---|---|---|
| Strong | Topping Formation / Structural Breakdown | Bearish | N/A | After a massive parabolic run, the price formed a sharp peak, followed by a lower high, and subsequently broke below the 50-week SMA. This change in market structure indicates a significant shift from accumulation to distribution. |
Frequently Asked Questions about COST
What is the current sentiment for COST?
The short-term sentiment for COST is currently Bearish because Price is trading below both the 20-week and 50-week SMAs, establishing a pattern of lower highs and lower lows. MACD is deep in negative territory and RSI is below 50, indicating sustained downward momentum.. The long-term trend is classified as Neutral.
What are the key support levels for COST?
StockDips.AI has identified key support levels for COST at $835.00 and $785.00. These levels may represent potential accumulation zones where buying interest could emerge.
Is COST in a significant dip or a Value Dip right now?
COST has a Value Score of 58/100. It is not currently flagged as a significant dip in the Top Dips list. It is not listed as a Value Dip because the long-term sentiment or value-score threshold does not qualify.
View the full interactive analysis on StockDips.AI.