CRWV Weekly Technical Analysis
CoreWeave Inc
A specialized cloud provider for GPU-intensive computing, particularly for artificial intelligence (AI) and machine learning applications.
CRWV Technical Analysis Summary
CRWV is currently in a short-term bearish trend, testing a critical support zone around 65-70. The longer-term picture is neutral, as a potential complex head and shoulders topping pattern is forming. Investors should watch the key support level closely; a breakdown could lead to significant further downside, while a bounce could offer a short-term relief rally. A clear break above resistance levels is needed to resume the bullish narrative.
Included In Lists
Related Tickers of Interest
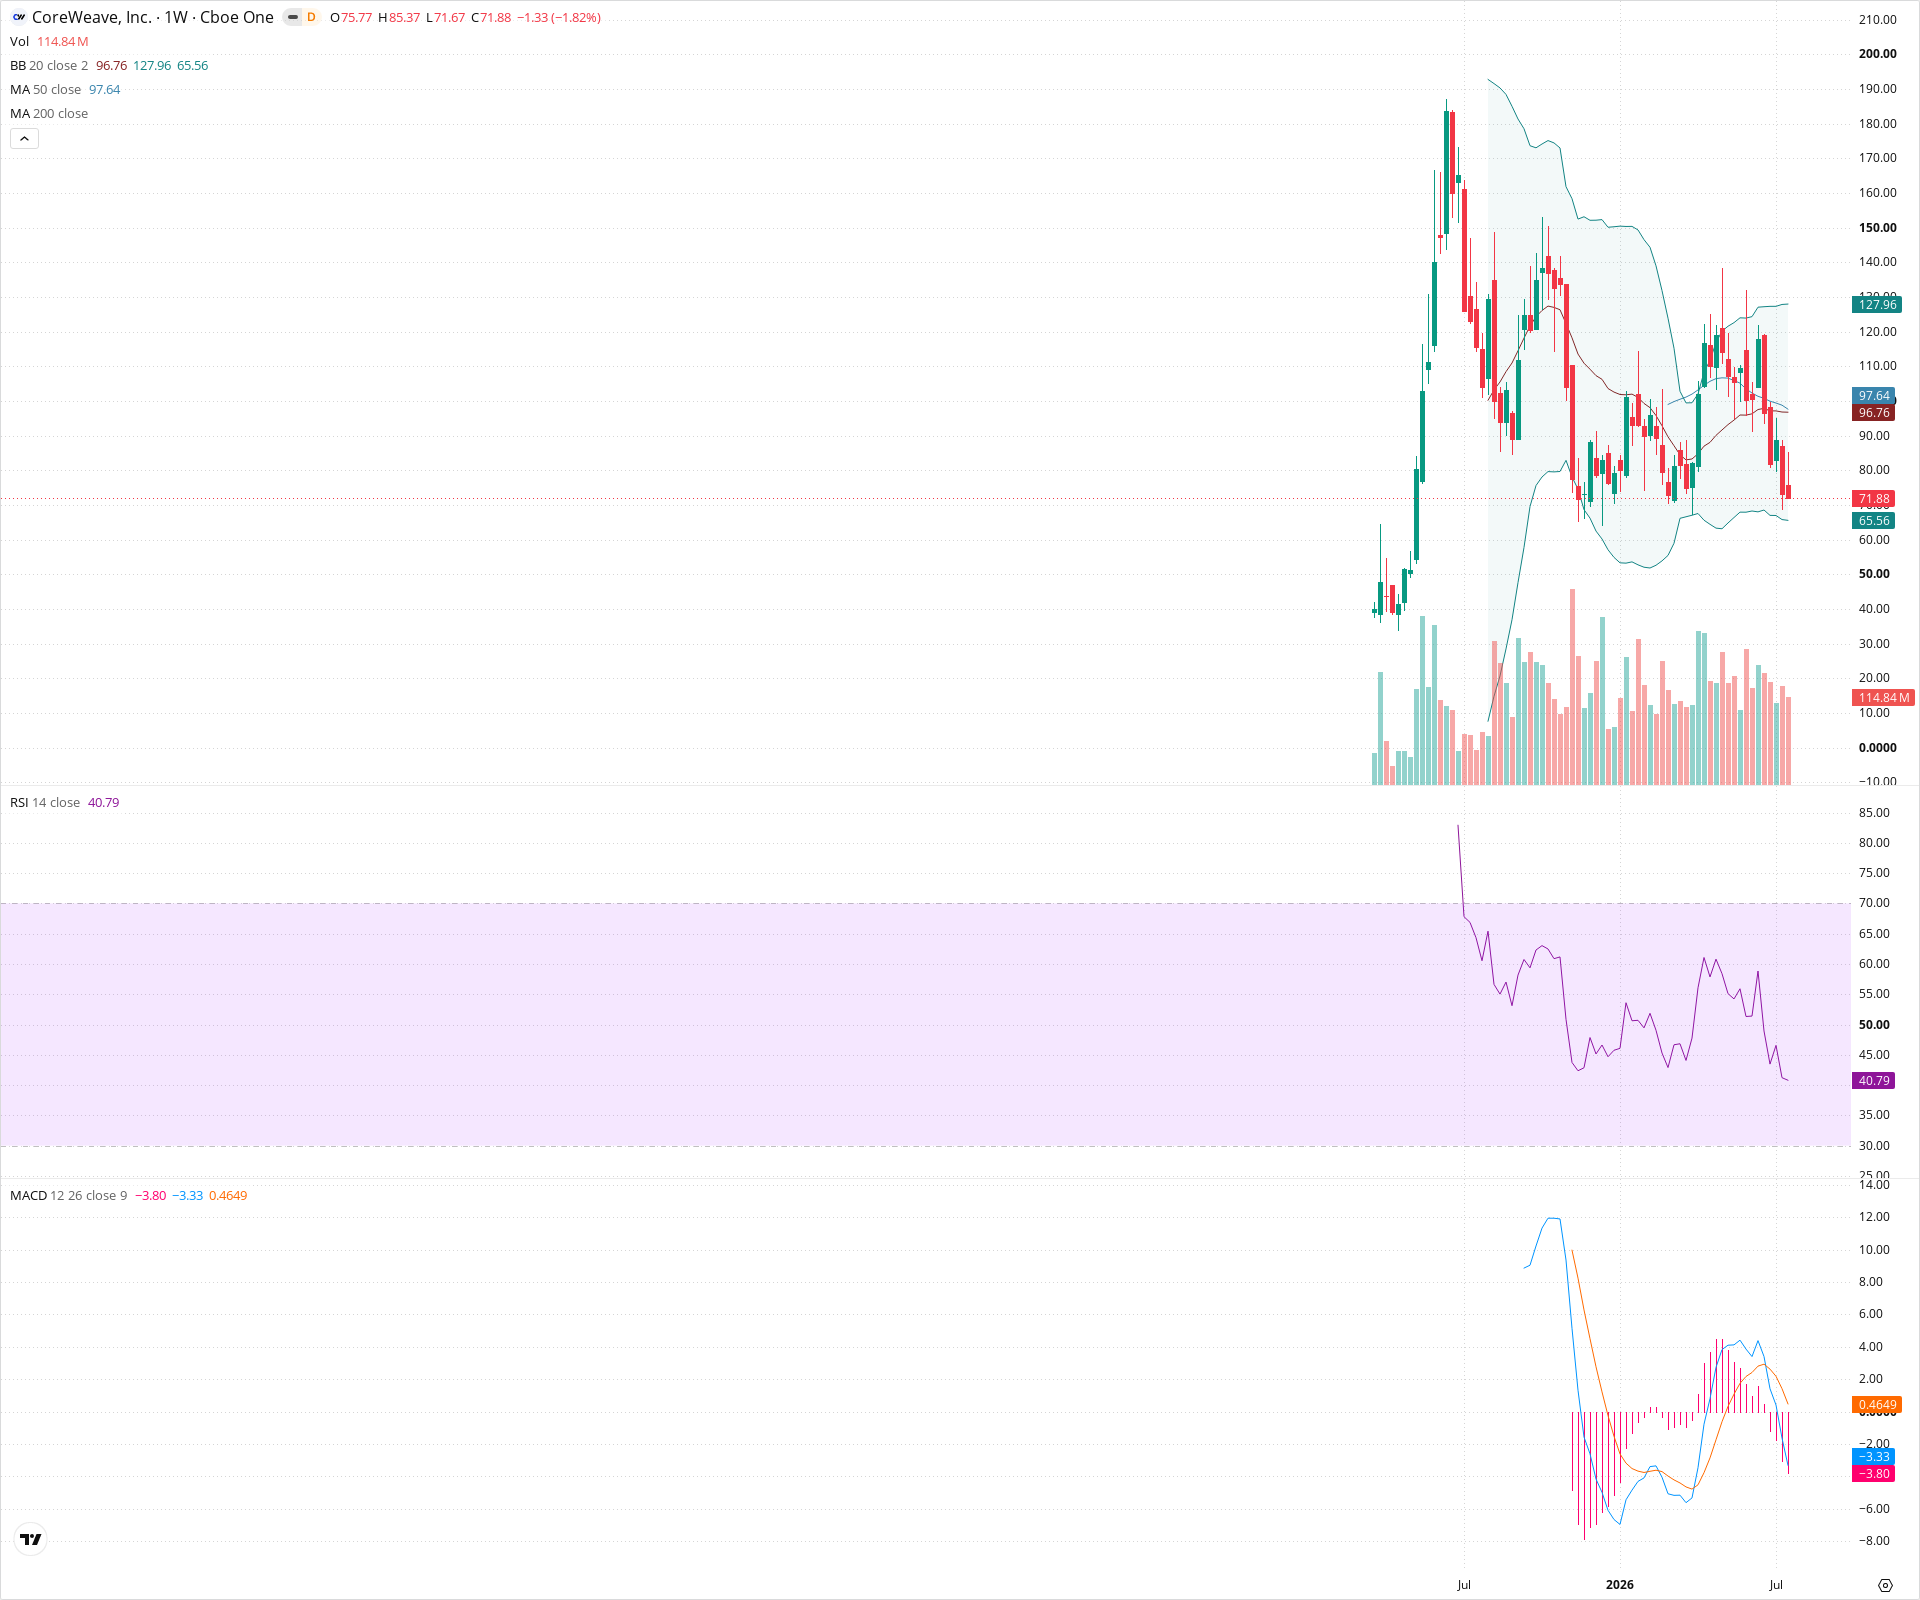
CRWV Weekly Chart
Sentiment
Short-term Sentiment (days to weeks): Bearish
The short-term trend shows a clear downward movement, with the price forming lower highs and lower lows. The price is currently below the 20 and 50 period SMAs. The RSI is trending downwards and is near the 40 level, indicating bearish momentum. The MACD histogram is negative, and the MACD line is below the signal line, confirming the short-term bearishness.
Long-term Sentiment (weeks to months): Neutral
The long-term sentiment is mixed. The price has experienced a significant uptrend followed by a substantial correction. The 50-period SMA is still upward-sloping, providing some longer-term bullish context, but the recent breakdown and the potential for a larger top formation warrant a neutral stance until a clearer trend emerges.
Report Metadata
- Timeframe: weekly
- Generated at: 2026-07-25T09:13:54.921Z
- Model: gemini-3.1-pro-preview
Support Price Levels
| Level | Range | Strength | Notes |
|---|---|---|---|
| $67.50 | $65.00 - $70.00 | Strong | Significant previous support zone where the price has bounced multiple times in the past. It's a critical level to watch for potential reversals or further breakdowns. |
| $52.50 | $50.00 - $55.00 | Weak | A minor psychological support level, but there's less historical price action here compared to higher levels. |
Resistance Price Levels
| Level | Range | Strength | Notes |
|---|---|---|---|
| $95.00 | $90.00 - $100.00 | Strong | A major resistance zone that coincides with previous lower highs and the 50-period SMA. A break above this level would be necessary to shift the short-term momentum back to bullish. |
| $125.00 | $120.00 - $130.00 | Strong | A significant previous resistance zone where the price faced strong selling pressure. Breaking this level would signal a potential continuation of the long-term uptrend. |
Potential Chart Patterns in Formation
| Strength | Pattern | Signal | Target | Details |
|---|---|---|---|---|
| Strong | Head and Shoulders (potential) | Bearish | N/A | The price action suggests a potential complex head and shoulders topping pattern, with the left shoulder around 170-180, the head around 190-200, and a complex right shoulder forming between 110-130. A break below the neckline (around 65-70) would confirm the pattern. |
Frequently Asked Questions about CRWV
What is the current sentiment for CRWV?
The short-term sentiment for CRWV is currently Bearish because The short-term trend shows a clear downward movement, with the price forming lower highs and lower lows. The price is currently below the 20 and 50 period SMAs. The RSI is trending downwards and is near the 40 level, indicating bearish momentum. The MACD histogram is negative, and the MACD line is below the signal line, confirming the short-term bearishness.. The long-term trend is classified as Neutral.
What are the key support levels for CRWV?
StockDips.AI has identified key support levels for CRWV at $67.50 and $52.50. These levels may represent potential accumulation zones where buying interest could emerge.
Is CRWV in a significant dip or a Value Dip right now?
CRWV has a Value Score of 56/100. It is not currently flagged as a significant dip in the Top Dips list. It is not listed as a Value Dip because the long-term sentiment or value-score threshold does not qualify.
View the full interactive analysis on StockDips.AI.