DIS Daily Technical Analysis
Walt Disney Co.
Entertainment company with movies, TV, theme parks, and the Disney+ streaming service.
DIS Technical Analysis Summary
The technical picture for DIS remains solidly bearish on a long-term basis, with price action suppressed below declining 50-day and 200-day moving averages. While short-term momentum shows tentative signs of stabilization near the $93 support level, the broader trend is downward. A convincing break above the 50-day SMA and $100 psychological level is necessary to begin shifting the macro outlook to neutral.
Included In Lists
Related Tickers of Interest
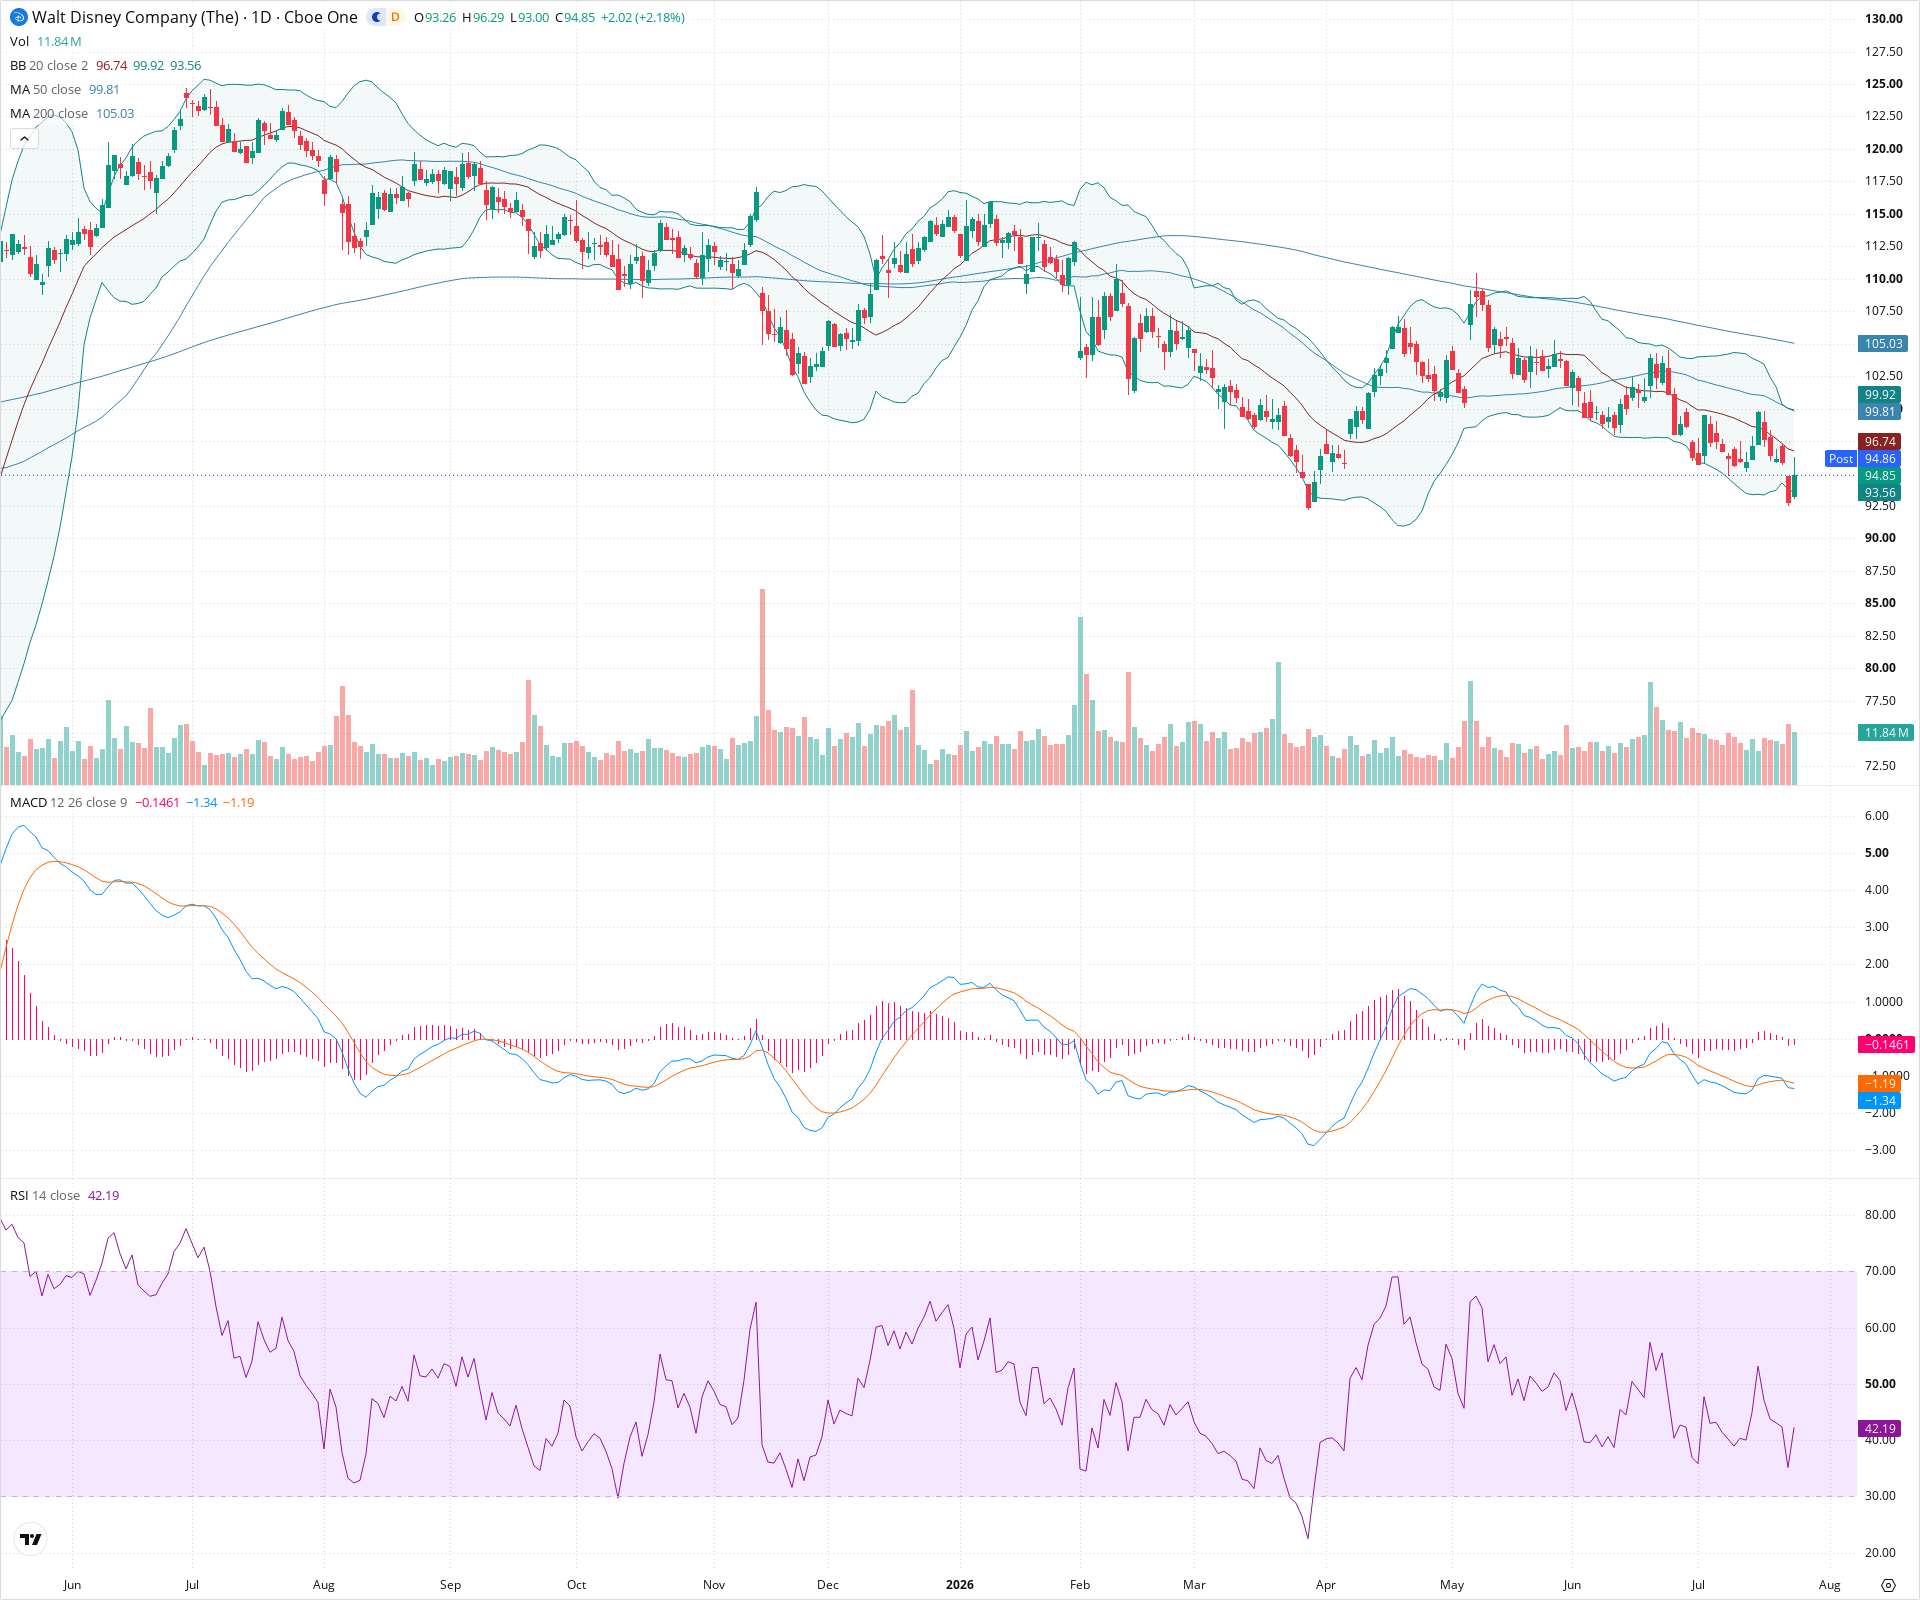
DIS Daily Chart
Sentiment
Short-term Sentiment (days to weeks): Bearish
Price remains below the 20-day and 50-day SMAs. Although there is a recent bounce off the lower Bollinger Band and the MACD histogram is slightly contracting, the overall short-term structure is still lower highs and lower lows.
Long-term Sentiment (weeks to months): Bearish
The chart shows a clear macro downtrend with the price well below a declining 200-day SMA, and the 50-day SMA is also trending downwards below the 200-day SMA.
Report Metadata
- Timeframe: daily
- Generated at: 2026-07-24T21:14:30.800Z
- Model: gemini-3.1-pro-preview
Support Price Levels
| Level | Range | Strength | Notes |
|---|---|---|---|
| $93.00 | $92.50 - $93.50 | Strong | Current active support zone; aligns with recent swing lows where price has bounced multiple times recently. |
| $90.25 | $89.50 - $91.00 | Strong | Major structural low visible on the left side of the chart, acting as a deep floor. |
Resistance Price Levels
| Level | Range | Strength | Notes |
|---|---|---|---|
| $97.00 | $96.50 - $97.50 | Weak | Initial overhead resistance near the declining 20-day SMA (middle Bollinger Band). |
| $99.75 | $99.00 - $100.50 | Strong | Significant resistance zone containing the 50-day SMA and psychological round number. |
| $105.00 | $104.00 - $106.00 | Strong | Major macro resistance level aligning with the declining 200-day SMA and previous swing highs. |
Potential Chart Patterns in Formation
| Strength | Pattern | Signal | Target | Details |
|---|---|---|---|---|
| Strong | Descending Trend | Bearish | N/A | A prolonged series of lower highs and lower lows dominating the chart's visible timeframe. |
| Weak | Potential Double Bottom | Neutral | N/A | Short-term pattern forming as price tests the ~93 level for a second distinct time recently. |
Frequently Asked Questions about DIS
What is the current sentiment for DIS?
The short-term sentiment for DIS is currently Bearish because Price remains below the 20-day and 50-day SMAs. Although there is a recent bounce off the lower Bollinger Band and the MACD histogram is slightly contracting, the overall short-term structure is still lower highs and lower lows.. The long-term trend is classified as Bearish.
What are the key support levels for DIS?
StockDips.AI has identified key support levels for DIS at $93.00 and $90.25. These levels may represent potential accumulation zones where buying interest could emerge.
Is DIS in a significant dip or a Value Dip right now?
DIS has a Value Score of 54/100. It is not currently flagged as a significant dip in the Top Dips list. It is not listed as a Value Dip because the long-term sentiment or value-score threshold does not qualify.
View the full interactive analysis on StockDips.AI.