DIS Weekly Technical Analysis
Walt Disney Co.
Entertainment company with movies, TV, theme parks, and the Disney+ streaming service.
DIS Technical Analysis Summary
Disney remains trapped in a protracted multi-year downtrend on the weekly timeframe. A recent rally attempt ultimately failed, forming a lower high before a sharp reversal that broke the price below all critical moving averages (20, 50, and 200-week). With both price action and momentum indicators confirming renewed downside pressure, the path of least resistance is lower, making a retest of the major 78-83 structural support zone a probable scenario.
Included In Lists
Related Tickers of Interest
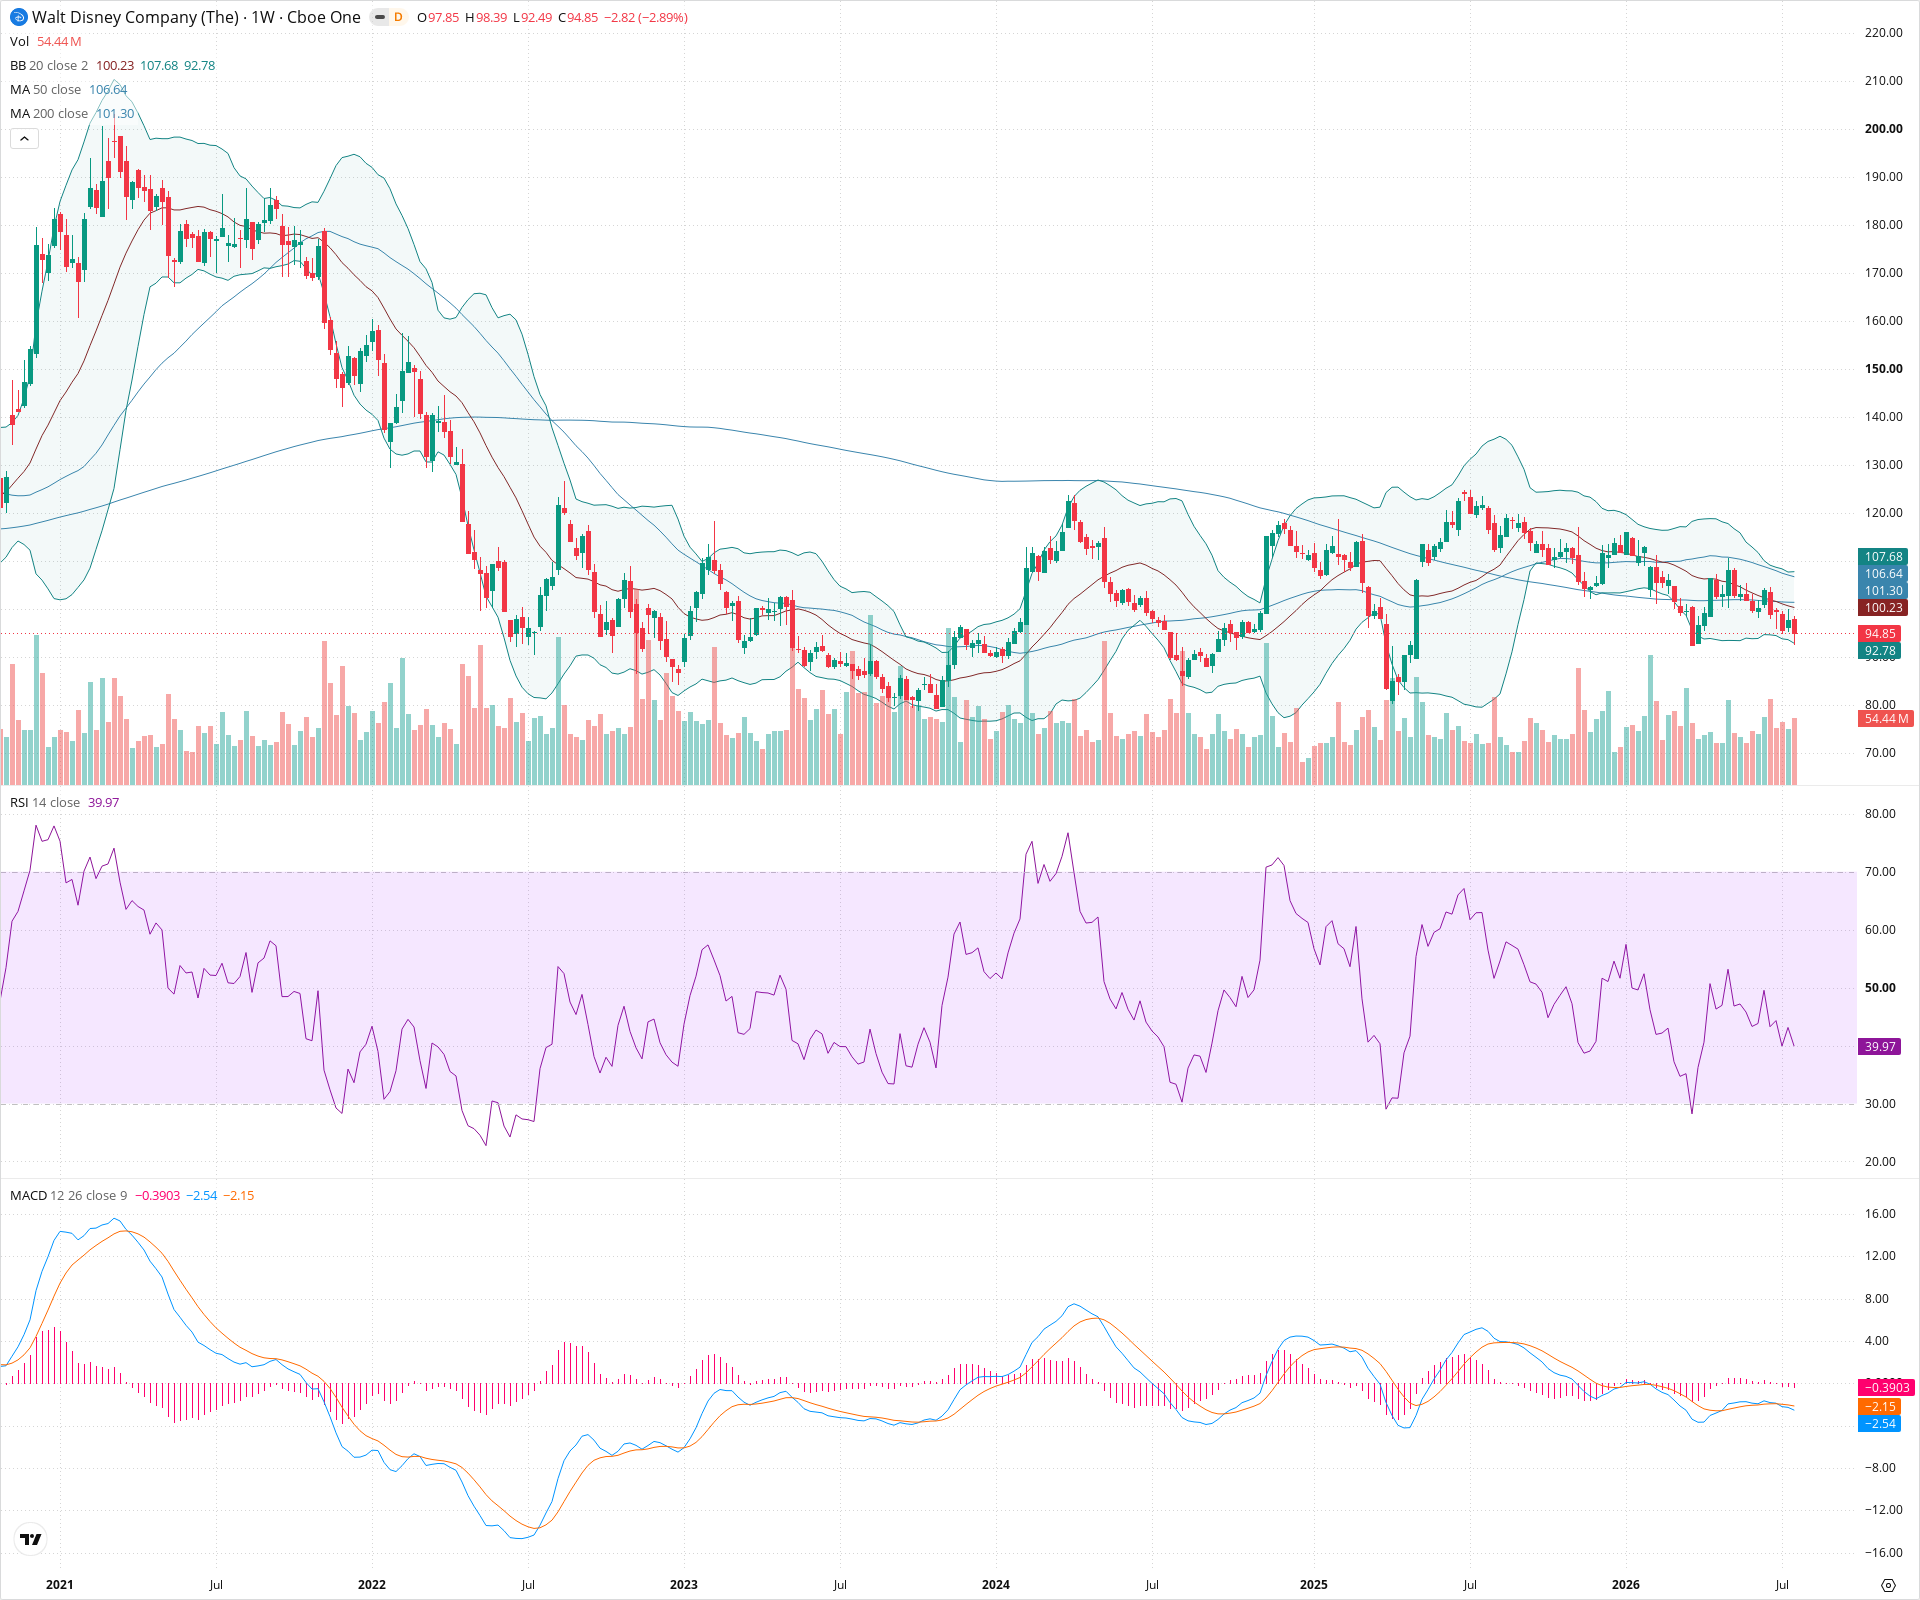
DIS Weekly Chart
Sentiment
Short-term Sentiment (days to weeks): Bearish
Price is in a steep short-term decline, having recently broken aggressively below the 20, 50, and 200-week SMAs. RSI is falling sharply toward oversold territory (39.97), and the MACD histogram is negative and expanding downwards.
Long-term Sentiment (weeks to months): Bearish
The macro structure remains dominated by a multi-year downtrend. A recent significant rally attempt failed to produce a higher high on a macro scale, and the subsequent rollover has pushed price back beneath a declining 50-week SMA, signaling a resumption of the broader bearish trend.
Report Metadata
- Timeframe: weekly
- Generated at: 2026-07-25T09:05:26.799Z
- Model: gemini-3.1-pro-preview
Support Price Levels
| Level | Range | Strength | Notes |
|---|---|---|---|
| $90.00 | $88.00 - $92.00 | Weak | Minor structural support zone based on previous swing lows and consolidation areas observed in early 2023 and early 2024. |
| $80.50 | $78.00 - $83.00 | Strong | Major multi-year structural support zone. This area formed a massive double bottom between late 2022 and late 2023. |
Resistance Price Levels
| Level | Range | Strength | Notes |
|---|---|---|---|
| $101.50 | $100.00 - $103.00 | Strong | Immediate overhead resistance zone created by the confluence of the 20-week SMA (100.23), the 200-week SMA (101.30), and the psychological $100 level. |
| $107.50 | $105.00 - $110.00 | Strong | Significant resistance defined by recent consolidation prior to the breakdown, reinforced by the declining 50-week SMA (106.64). |
Potential Chart Patterns in Formation
| Strength | Pattern | Signal | Target | Details |
|---|---|---|---|---|
| Strong | Lower High Failure / Breakdown | Bearish | N/A | After a multi-month rally peaking near 125, the price formed a decisive lower high relative to historical peaks. It has subsequently broken down aggressively through multiple support shelves and key moving averages, confirming structural weakness. |
Frequently Asked Questions about DIS
What is the current sentiment for DIS?
The short-term sentiment for DIS is currently Bearish because Price is in a steep short-term decline, having recently broken aggressively below the 20, 50, and 200-week SMAs. RSI is falling sharply toward oversold territory (39.97), and the MACD histogram is negative and expanding downwards.. The long-term trend is classified as Bearish.
What are the key support levels for DIS?
StockDips.AI has identified key support levels for DIS at $90.00 and $80.50. These levels may represent potential accumulation zones where buying interest could emerge.
Is DIS in a significant dip or a Value Dip right now?
DIS has a Value Score of 54/100. It is not currently flagged as a significant dip in the Top Dips list. It is not listed as a Value Dip because the long-term sentiment or value-score threshold does not qualify.
View the full interactive analysis on StockDips.AI.