HPE Weekly Technical Analysis
Hewlett Packard Enterprise
Provides enterprise technology solutions including cloud services, data center servers, storage, and networking hardware.
HPE Technical Analysis Summary
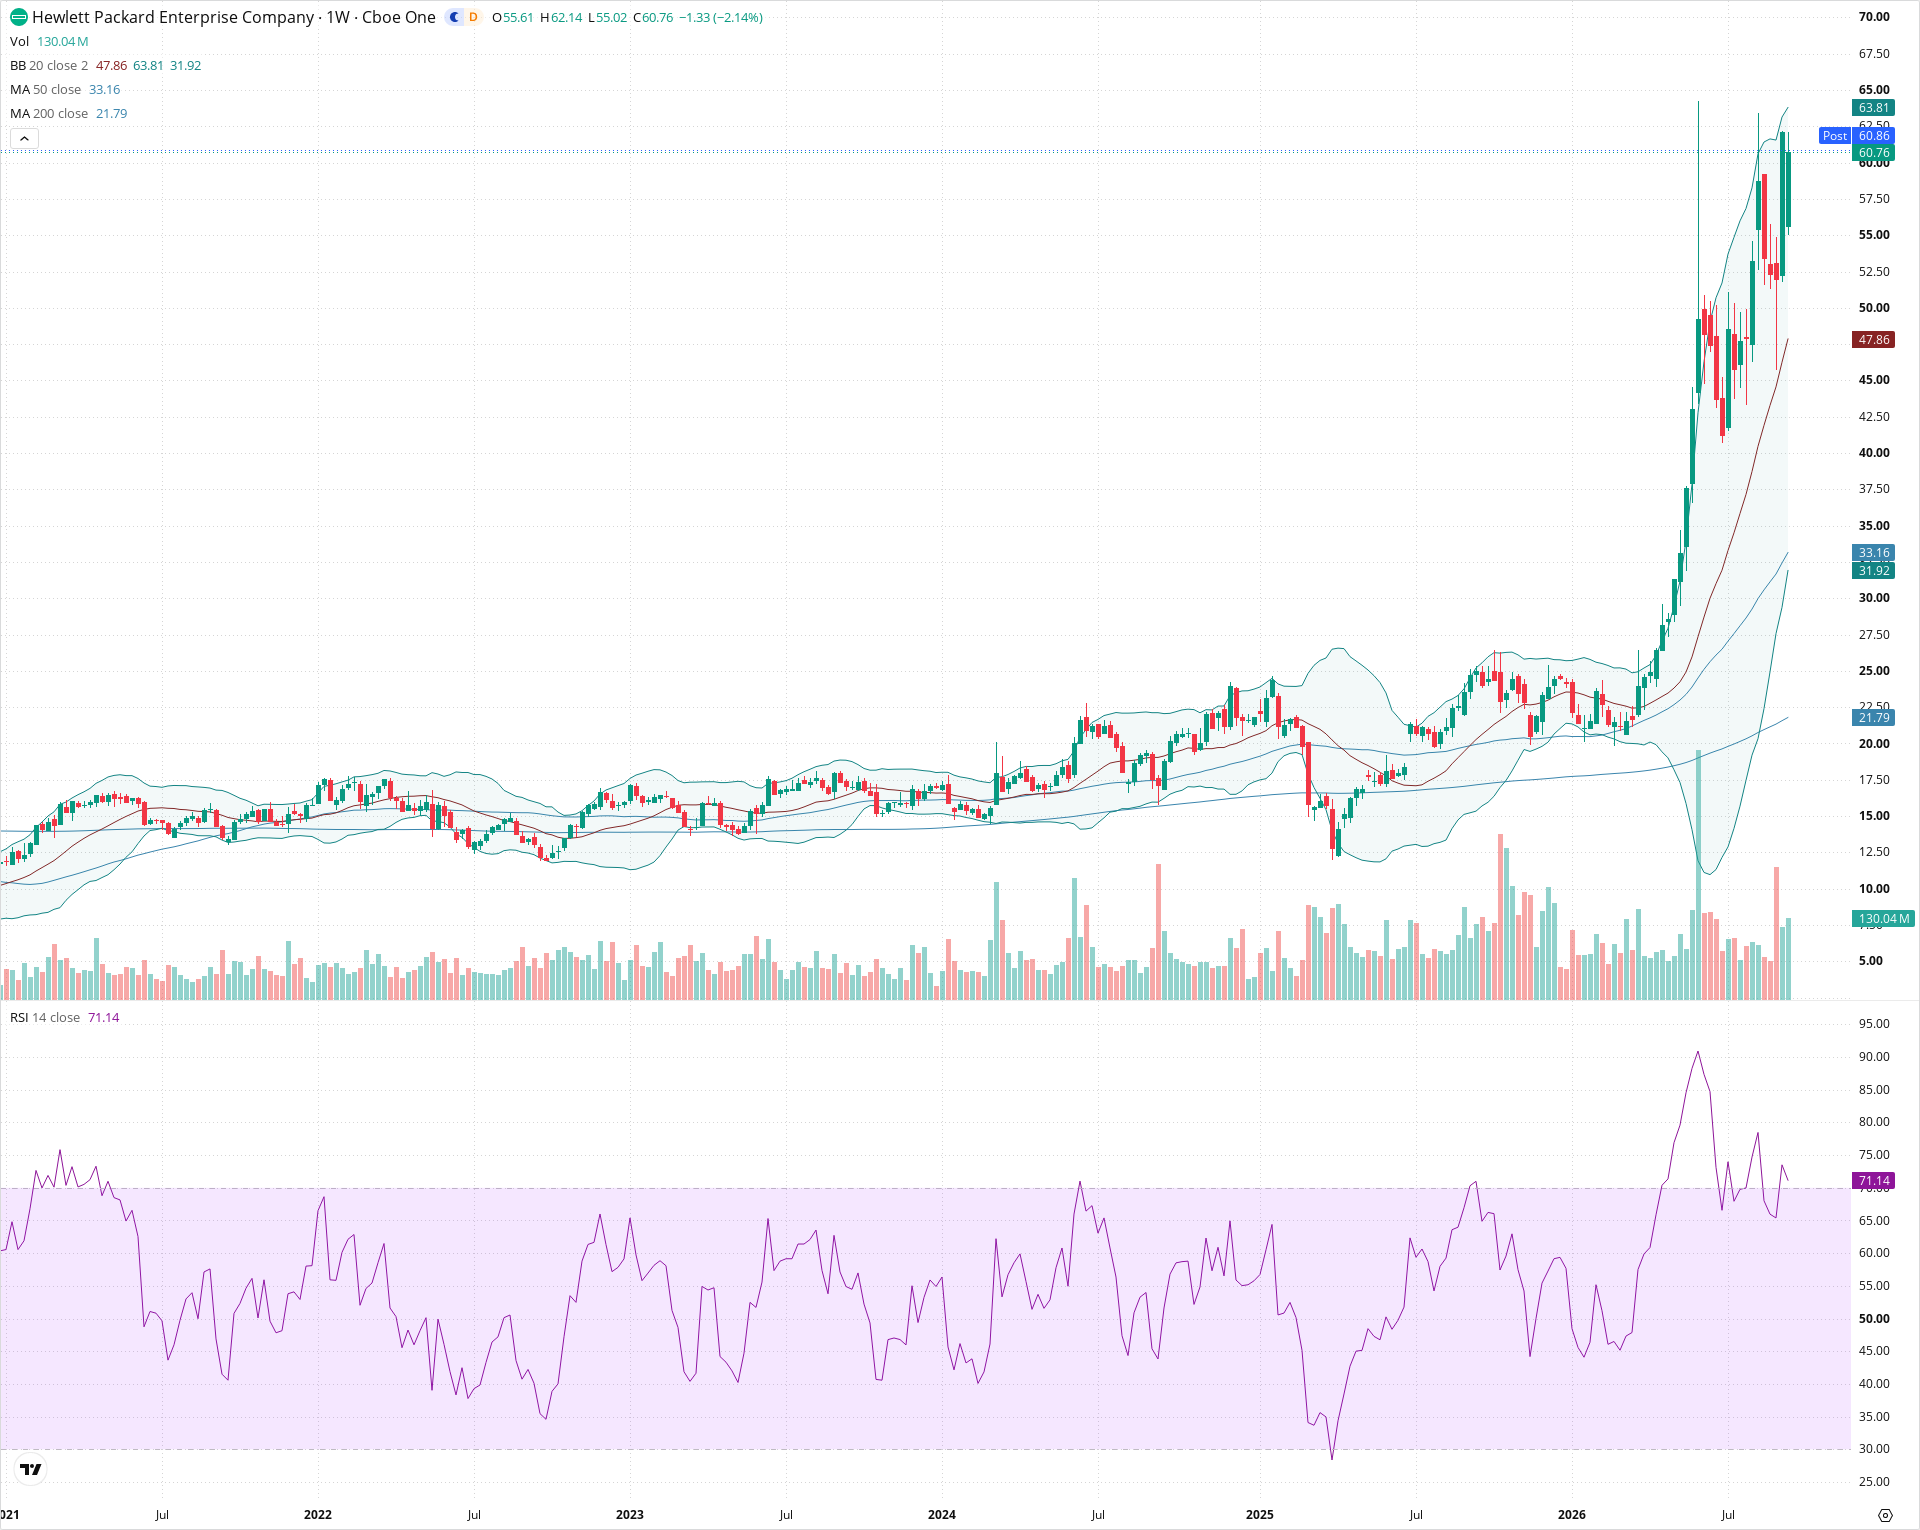
Hewlett Packard Enterprise is in a strong macro uptrend following an explosive multi-year base breakout above $27, establishing an intact bullish moving-average stack across the weekly timeframe. The stock is currently digesting its parabolic advance in a high-level consolidation range between roughly $52 and $65, remaining well-supported above its rising 20-week moving average. A confirmed weekly close above $65 would signal continuation into open air, while pullbacks toward the $45–$48 zone represent key dynamic trend support.
Included In Lists
Related Tickers of Interest
HPE Weekly Chart
Sentiment
Short-term Sentiment (days to weeks): Bullish
Price remains consolidated near multi-year highs above the upward-trending 20-week SMA, with RSI stabilizing above 70 after a parabolic impulse.
Long-term Sentiment (weeks to months): Bullish
Price trades decisively above both the rising 50-week (33.16) and 200-week (21.79) SMAs following a powerful structural breakout from the multi-year $15-$27 base.
Report Metadata
- Timeframe: weekly
- Generated at: 2026-09-18T21:05:46.718Z
- Model: gemini-3.8-flash
Support Price Levels
| Level | Range | Strength | Notes |
|---|---|---|---|
| $53.50 | $52.00 - $55.00 | Moderate | Recent weekly swing pullback lows and consolidation shelf. |
| $46.50 | $45.00 - $48.00 | Strong | Confluence of the rising 20-week SMA (47.86) and the initial pullback low after the explosive expansion. |
| $26.25 | $25.00 - $27.50 | Strong | Major multi-year breakout boundary and previous long-term horizontal resistance. |
Resistance Price Levels
| Level | Range | Strength | Notes |
|---|---|---|---|
| $64.25 | $63.50 - $65.00 | Strong | Current all-time high zone and upper Bollinger Band (63.81) cap. |
Potential Chart Patterns in Formation
| Strength | Pattern | Signal | Target | Details |
|---|---|---|---|---|
| Moderate | High-Tight Flag / High-Level Consolidation | Bullish | $75.00 | A volatile consolidation range forming between roughly $52 and $65 directly following a sharp multi-week vertical advance. |
| Strong | Multi-Year Range Breakout | Bullish | N/A | Decisive high-volume expansion exiting a multi-year base above the $25-$27 ceiling, shifting the macro trend into a powerful markup phase. |
Frequently Asked Questions about HPE
What is the current sentiment for HPE?
The short-term sentiment for HPE is currently Bullish because Price remains consolidated near multi-year highs above the upward-trending 20-week SMA, with RSI stabilizing above 70 after a parabolic impulse.. The long-term trend is classified as Bullish.
What are the key support levels for HPE?
StockDips.AI has identified key support levels for HPE at $53.50 and $46.50. These levels may represent potential accumulation zones where buying interest could emerge.
Is HPE in a significant dip or a Value Dip right now?
HPE has a Value Score of 21/100. It is not currently flagged as a significant dip in the Top Dips list. It is not listed as a Value Dip because the long-term sentiment or value-score threshold does not qualify.
View the full interactive analysis on StockDips.AI.