Hewlett Packard Enterprise (HPE) Monthly Technical Analysis
Hewlett Packard Enterprise
Provides enterprise technology solutions including cloud services, data center servers, storage, and networking hardware.
HPE Technical Analysis Summary
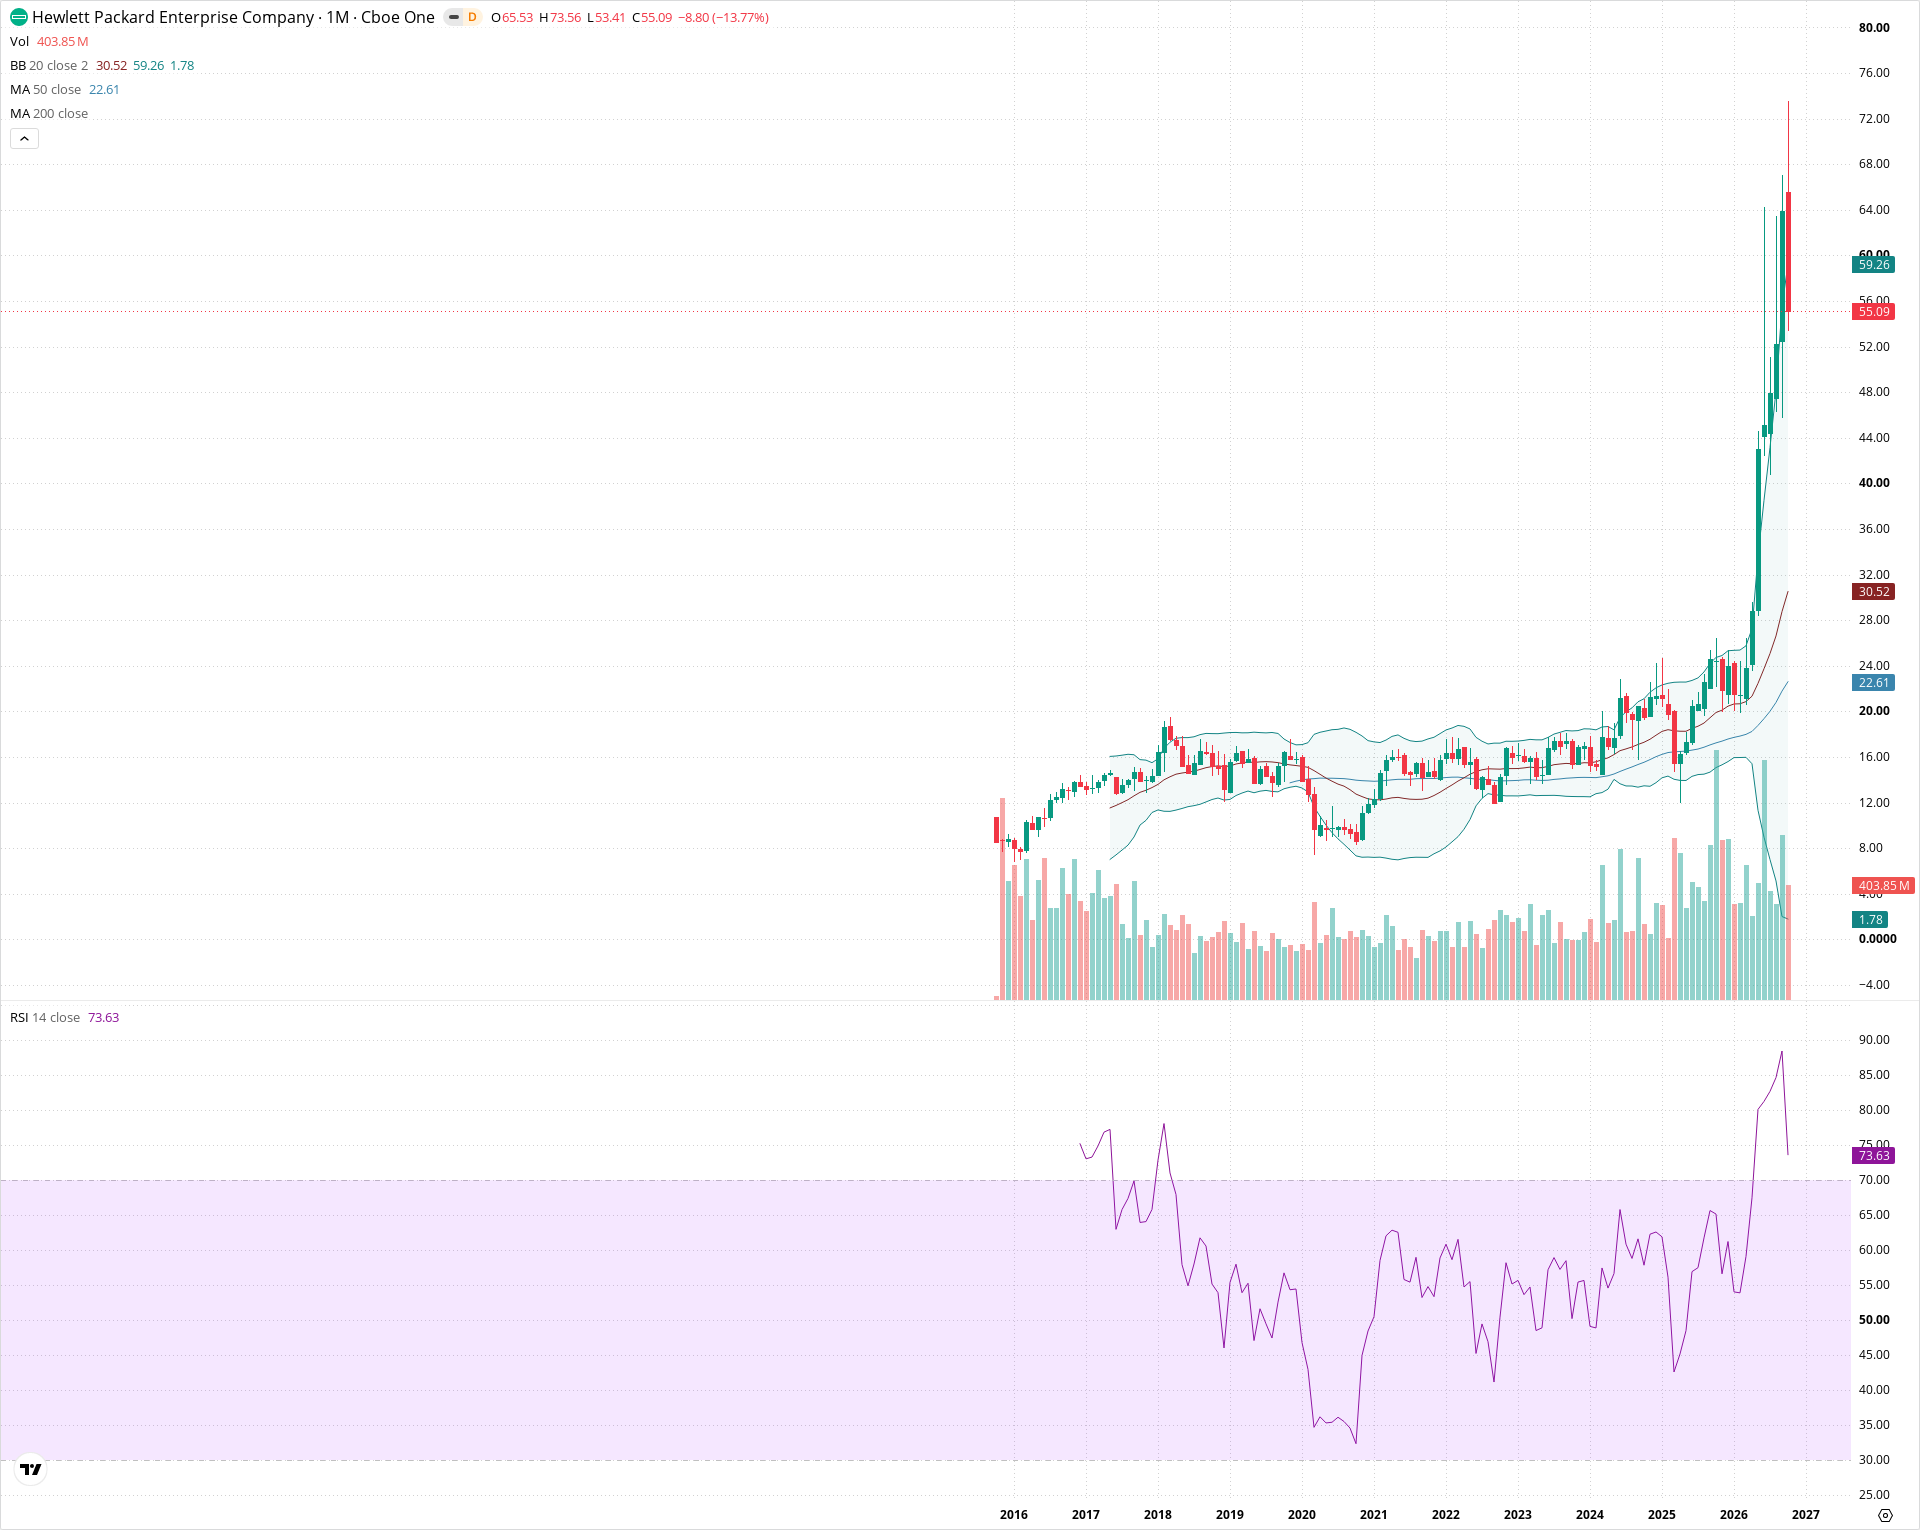
HPE is in a confirmed secular bull market following a decisive multi-year breakout from its 2017-2024 accumulation range. While the current monthly bar exhibits sharp profit-taking after tagging an all-time high of 73.56, long-term structure remains firmly bullish as price trades far above its rising 20-month and 50-month moving averages with RSI sustaining above 70.
Included In Lists
Related Tickers of Interest
HPE Monthly Chart
Sentiment
Short-term Sentiment (days to weeks): Bullish
Price remains in a strong macro uptrend following a vertical expansion, though currently experiencing a volatile corrective pullback from the 73.56 peak while holding well above key trend-following moving averages.
Long-term Sentiment (weeks to months): Bullish
Decisive secular breakout above the multi-year 18.00-20.00 base, supported by upward-sloping moving averages and monthly RSI holding above 70 in a strong secular bull regime.
Report Metadata
- Timeframe: monthly
- Generated at: Nov 1, 2026
- Model: gemini-3.8-flash
Support Price Levels
| Level | Range | Strength | Notes |
|---|---|---|---|
| $30.00 | $28.00 - $32.00 | Moderate | Confluence of prior intermediate consolidation and the rising 20-month SMA. |
| $20.30 | $18.00 - $22.60 | Strong | Multi-year structural base breakout zone and alignment with the 50-month moving average. |
Resistance Price Levels
| Level | Range | Strength | Notes |
|---|---|---|---|
| $65.00 | $64.00 - $66.00 | Moderate | Current month opening level and lower boundary of the recent peak cluster. |
| $73.00 | $72.00 - $74.00 | Strong | All-time high peak rejection area reached at 73.56. |
Potential Chart Patterns in Formation
| Strength | Pattern | Signal | Target | Details |
|---|---|---|---|---|
| Strong | Multi-Year Base Breakout | Bullish | N/A | Massive multi-year base consolidation between 2017 and 2024 broken decisively to the upside, resulting in a rapid expansion phase. |
Frequently Asked Questions about HPE
What is the current sentiment for HPE?
The short-term sentiment for HPE is currently Bullish because Price remains in a strong macro uptrend following a vertical expansion, though currently experiencing a volatile corrective pullback from the 73.56 peak while holding well above key trend-following moving averages. The long-term trend is classified as Bullish.
What are the key support levels for HPE?
StockDips.AI has identified key support levels for HPE at $30.00 and $20.30. These levels may represent potential accumulation zones where buying interest could emerge.
Is HPE in a significant dip or a Value Dip right now?
HPE has a Value Score of 70/100. It is not currently flagged as a significant dip in the Top Dips list. It is not listed as a Value Dip because the long-term sentiment or value-score threshold does not qualify.
View the full interactive analysis on StockDips.AI.