INTC Daily Technical Analysis
Intel Corporation
Semiconductor company producing CPUs and data center products.
INTC Technical Analysis Summary
INTC's chart shows a dramatic technical breakdown from a parabolic advance, highlighted by a massive gap down and intense selling pressure. Short-term momentum is severely negative across multiple indicators. While the price is still above the long-term 200-day SMA, the severity of the recent drop suggests significant technical damage that will likely require substantial time to repair, with further downside testing of the 80-86 support zone highly possible.
Included In Lists
Related Tickers of Interest
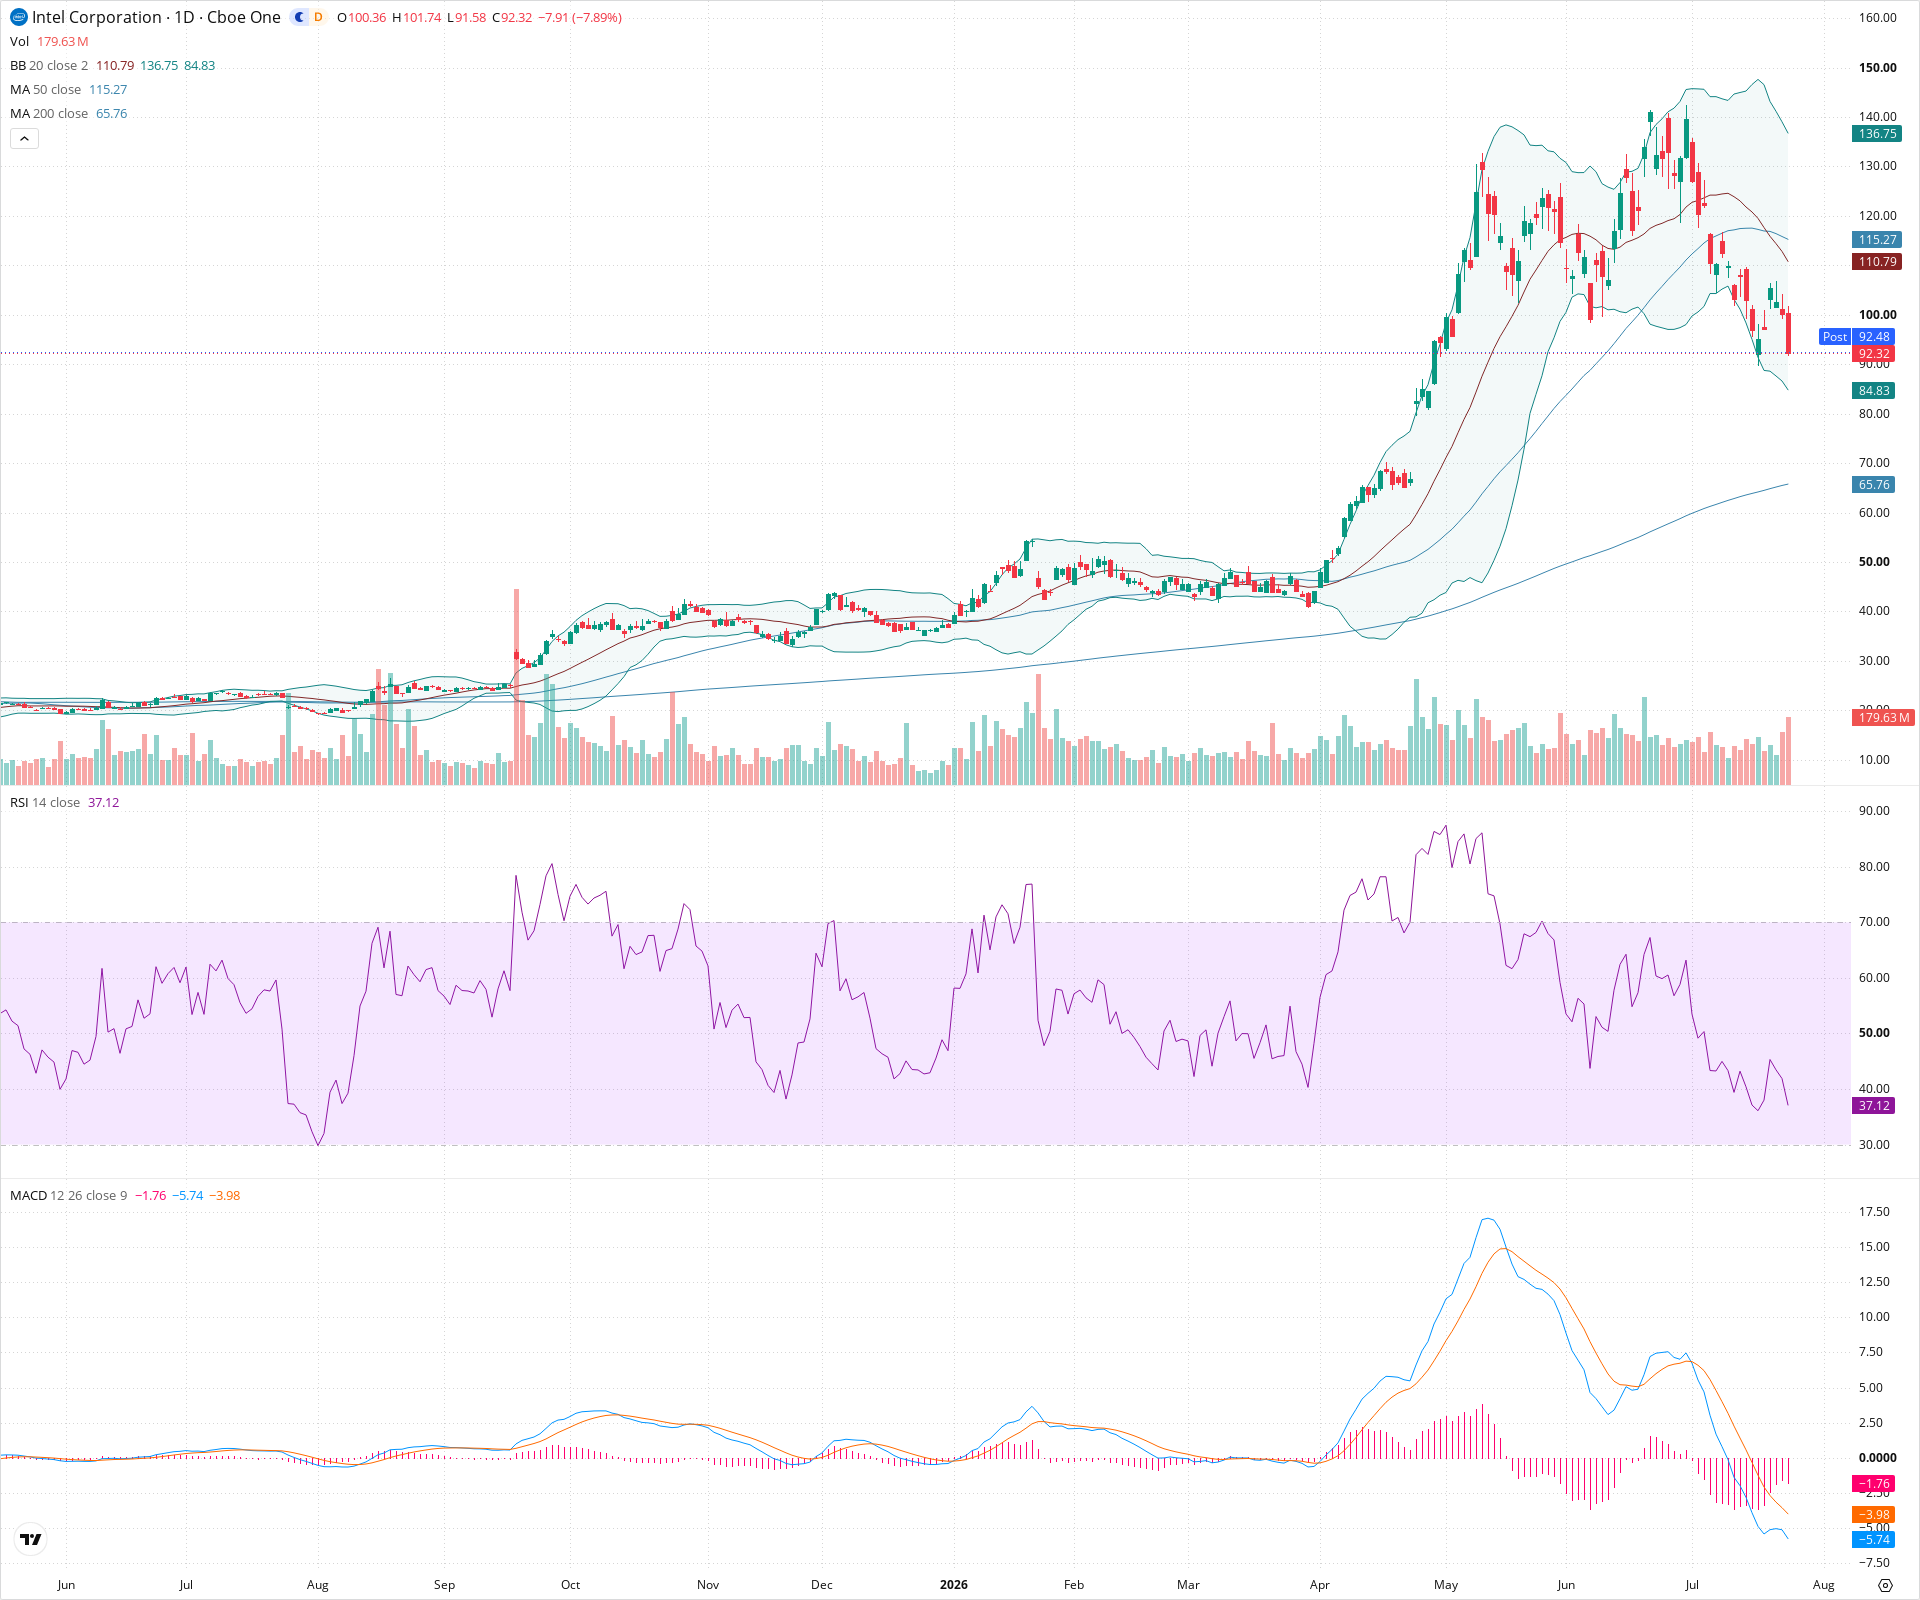
INTC Daily Chart
Sentiment
Short-term Sentiment (days to weeks): Bearish
Price has experienced a massive gap down on high volume and is currently trading near the lower Bollinger Band, well below the 20 and 50-day SMAs. MACD shows strong downward momentum with expanding negative histogram bars, and RSI is plunging toward oversold territory.
Long-term Sentiment (weeks to months): Neutral
The recent severe breakdown has damaged the prior parabolic uptrend structure. However, the price remains significantly above the rising 200-day SMA, keeping the broader long-term picture from turning completely bearish.
Report Metadata
- Timeframe: daily
- Generated at: 2026-07-24T21:17:44.400Z
- Model: gemini-3.1-pro-preview
Support Price Levels
| Level | Range | Strength | Notes |
|---|---|---|---|
| $83.00 | $80.00 - $86.00 | Strong | Prior extended consolidation zone and swing levels that served as a launching pad for the April breakout. |
| $67.50 | $65.00 - $70.00 | Strong | Major structural support zone coinciding with the current trajectory of the 200-day SMA. |
Resistance Price Levels
| Level | Range | Strength | Notes |
|---|---|---|---|
| $102.50 | $100.00 - $105.00 | Strong | The bottom edge of the recent massive gap down and a psychological round number level. |
| $113.00 | $110.00 - $116.00 | Strong | The top of the gap down area, aligning with prior support and the declining 20 and 50-day SMAs. |
Potential Chart Patterns in Formation
| Strength | Pattern | Signal | Target | Details |
|---|---|---|---|---|
| Strong | Gap Down Breakdown | Bearish | N/A | A visually extreme gap down on elevated volume, breaking short-term structural support and indicating aggressive distribution. |
| Strong | Double Top | Bearish | $80.00 | Price formed two distinct peaks in the 135-140 range before breaking sharply below the intervening trough, solidifying a trend reversal. |
Frequently Asked Questions about INTC
What is the current sentiment for INTC?
The short-term sentiment for INTC is currently Bearish because Price has experienced a massive gap down on high volume and is currently trading near the lower Bollinger Band, well below the 20 and 50-day SMAs. MACD shows strong downward momentum with expanding negative histogram bars, and RSI is plunging toward oversold territory.. The long-term trend is classified as Neutral.
What are the key support levels for INTC?
StockDips.AI has identified key support levels for INTC at $83.00 and $67.50. These levels may represent potential accumulation zones where buying interest could emerge.
Is INTC in a significant dip or a Value Dip right now?
INTC has a Value Score of 52/100. It is not currently flagged as a significant dip in the Top Dips list. It is not listed as a Value Dip because the long-term sentiment or value-score threshold does not qualify.
View the full interactive analysis on StockDips.AI.