AMD Daily Technical Analysis
Advanced Micro Devices Inc.
Designs CPUs and GPUs for PCs and data centers competing with Intel and NVIDIA.
AMD Technical Analysis Summary
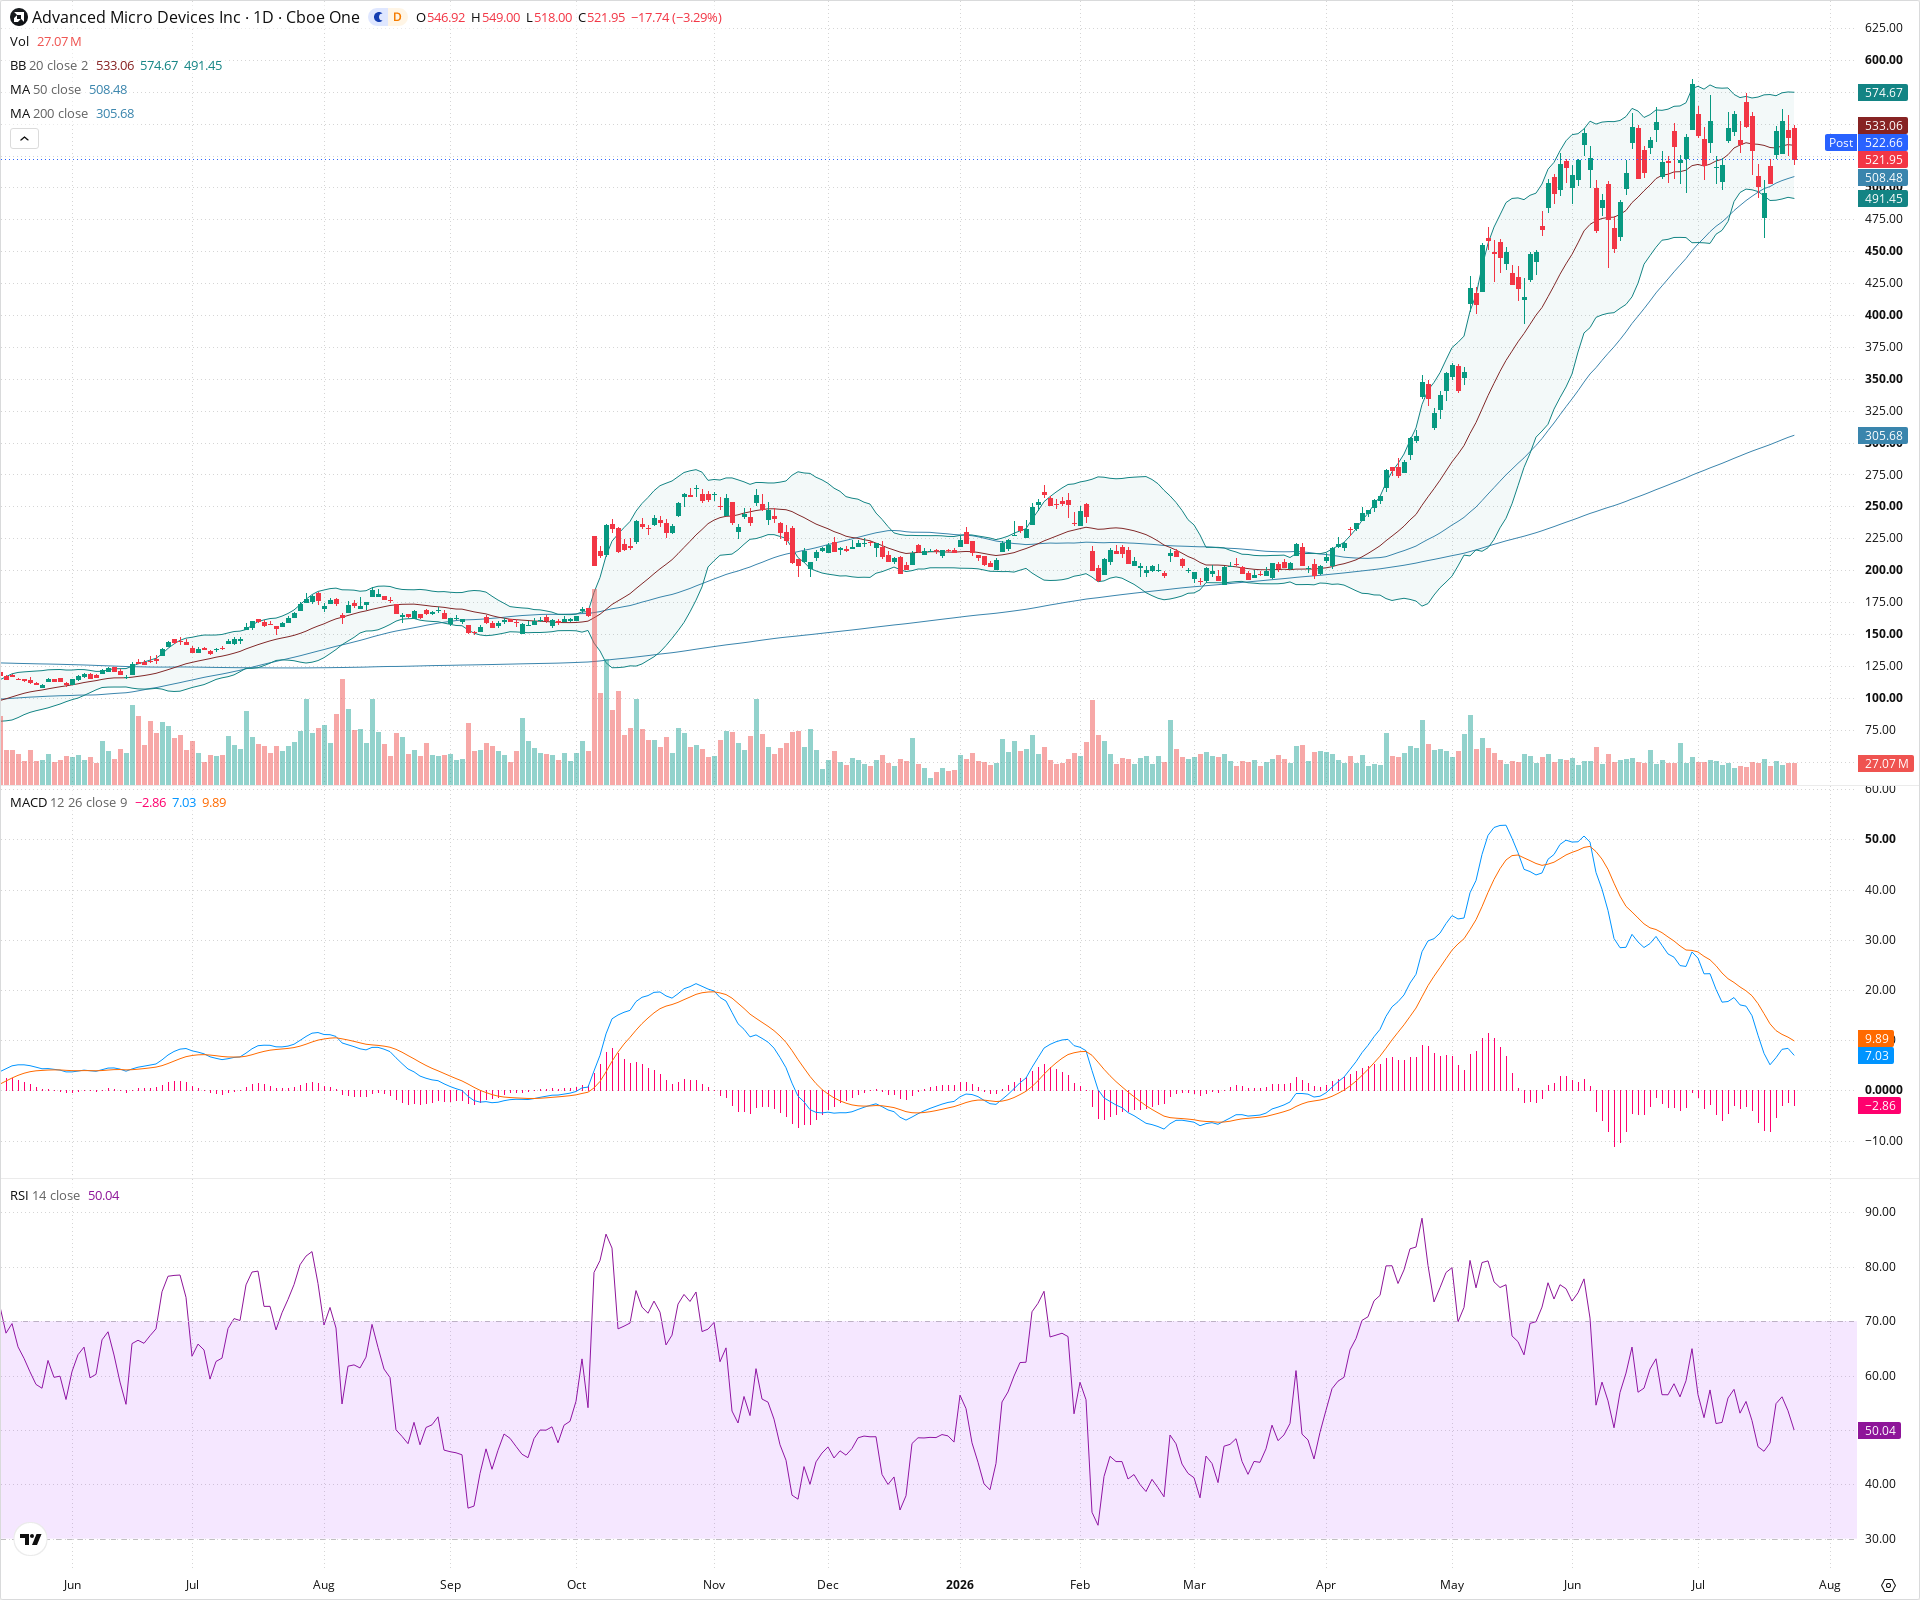
AMD is in a clear, long-term secular uptrend, characterized by a rising 200-day moving average and strong prior upward price discovery. However, the stock is currently experiencing a short-term cooling-off period, with negative MACD momentum and price pulling back to test the 50-day SMA. Long-term investors may watch how the price interacts with the 500-515 support zone to determine if the prevailing trend will immediately resume or if a deeper correction is imminent.
Included In Lists
Related Tickers of Interest
AMD Daily Chart
Sentiment
Short-term Sentiment (days to weeks): Bearish
The price has recently fallen below the 20-day SMA, the MACD line has crossed below the signal line with a widening negative histogram, and the RSI is trending downwards, indicating short-term negative momentum.
Long-term Sentiment (weeks to months): Bullish
The long-term trend remains intact as the price is positioned well above a sharply rising 200-day SMA and is still hovering above the rising 50-day SMA, showing an overarching established uptrend.
Report Metadata
- Timeframe: daily
- Generated at: 2026-07-24T21:12:54.499Z
- Model: gemini-3.1-pro-preview
Support Price Levels
| Level | Range | Strength | Notes |
|---|---|---|---|
| $507.50 | $500.00 - $515.00 | Strong | Current zone of interest aligning closely with the 50-day SMA (approx 508) and psychological round number support. |
| $447.50 | $435.00 - $460.00 | Weak | Prior consolidation zone from April before the most recent leg up. |
Resistance Price Levels
| Level | Range | Strength | Notes |
|---|---|---|---|
| $545.00 | $535.00 - $555.00 | Weak | Short-term overhead resistance where the 20-day SMA currently sits and recent minor price rejection occurred. |
| $592.50 | $580.00 - $605.00 | Strong | Recent major swing highs and proximity to the upper Bollinger Band, forming a significant supply zone. |
Potential Chart Patterns in Formation
| Strength | Pattern | Signal | Target | Details |
|---|---|---|---|---|
| Weak | Pullback to moving average | Neutral | N/A | After a strong vertical rally, the price is undergoing a mean-reversion pullback toward the 50-day moving average. |
Frequently Asked Questions about AMD
What is the current sentiment for AMD?
The short-term sentiment for AMD is currently Bearish because The price has recently fallen below the 20-day SMA, the MACD line has crossed below the signal line with a widening negative histogram, and the RSI is trending downwards, indicating short-term negative momentum.. The long-term trend is classified as Bullish.
What are the key support levels for AMD?
StockDips.AI has identified key support levels for AMD at $507.50 and $447.50. These levels may represent potential accumulation zones where buying interest could emerge.
Is AMD in a significant dip or a Value Dip right now?
AMD has a Value Score of 61/100. It is not currently flagged as a significant dip in the Top Dips list. It is not listed as a Value Dip because the long-term sentiment or value-score threshold does not qualify.
View the full interactive analysis on StockDips.AI.