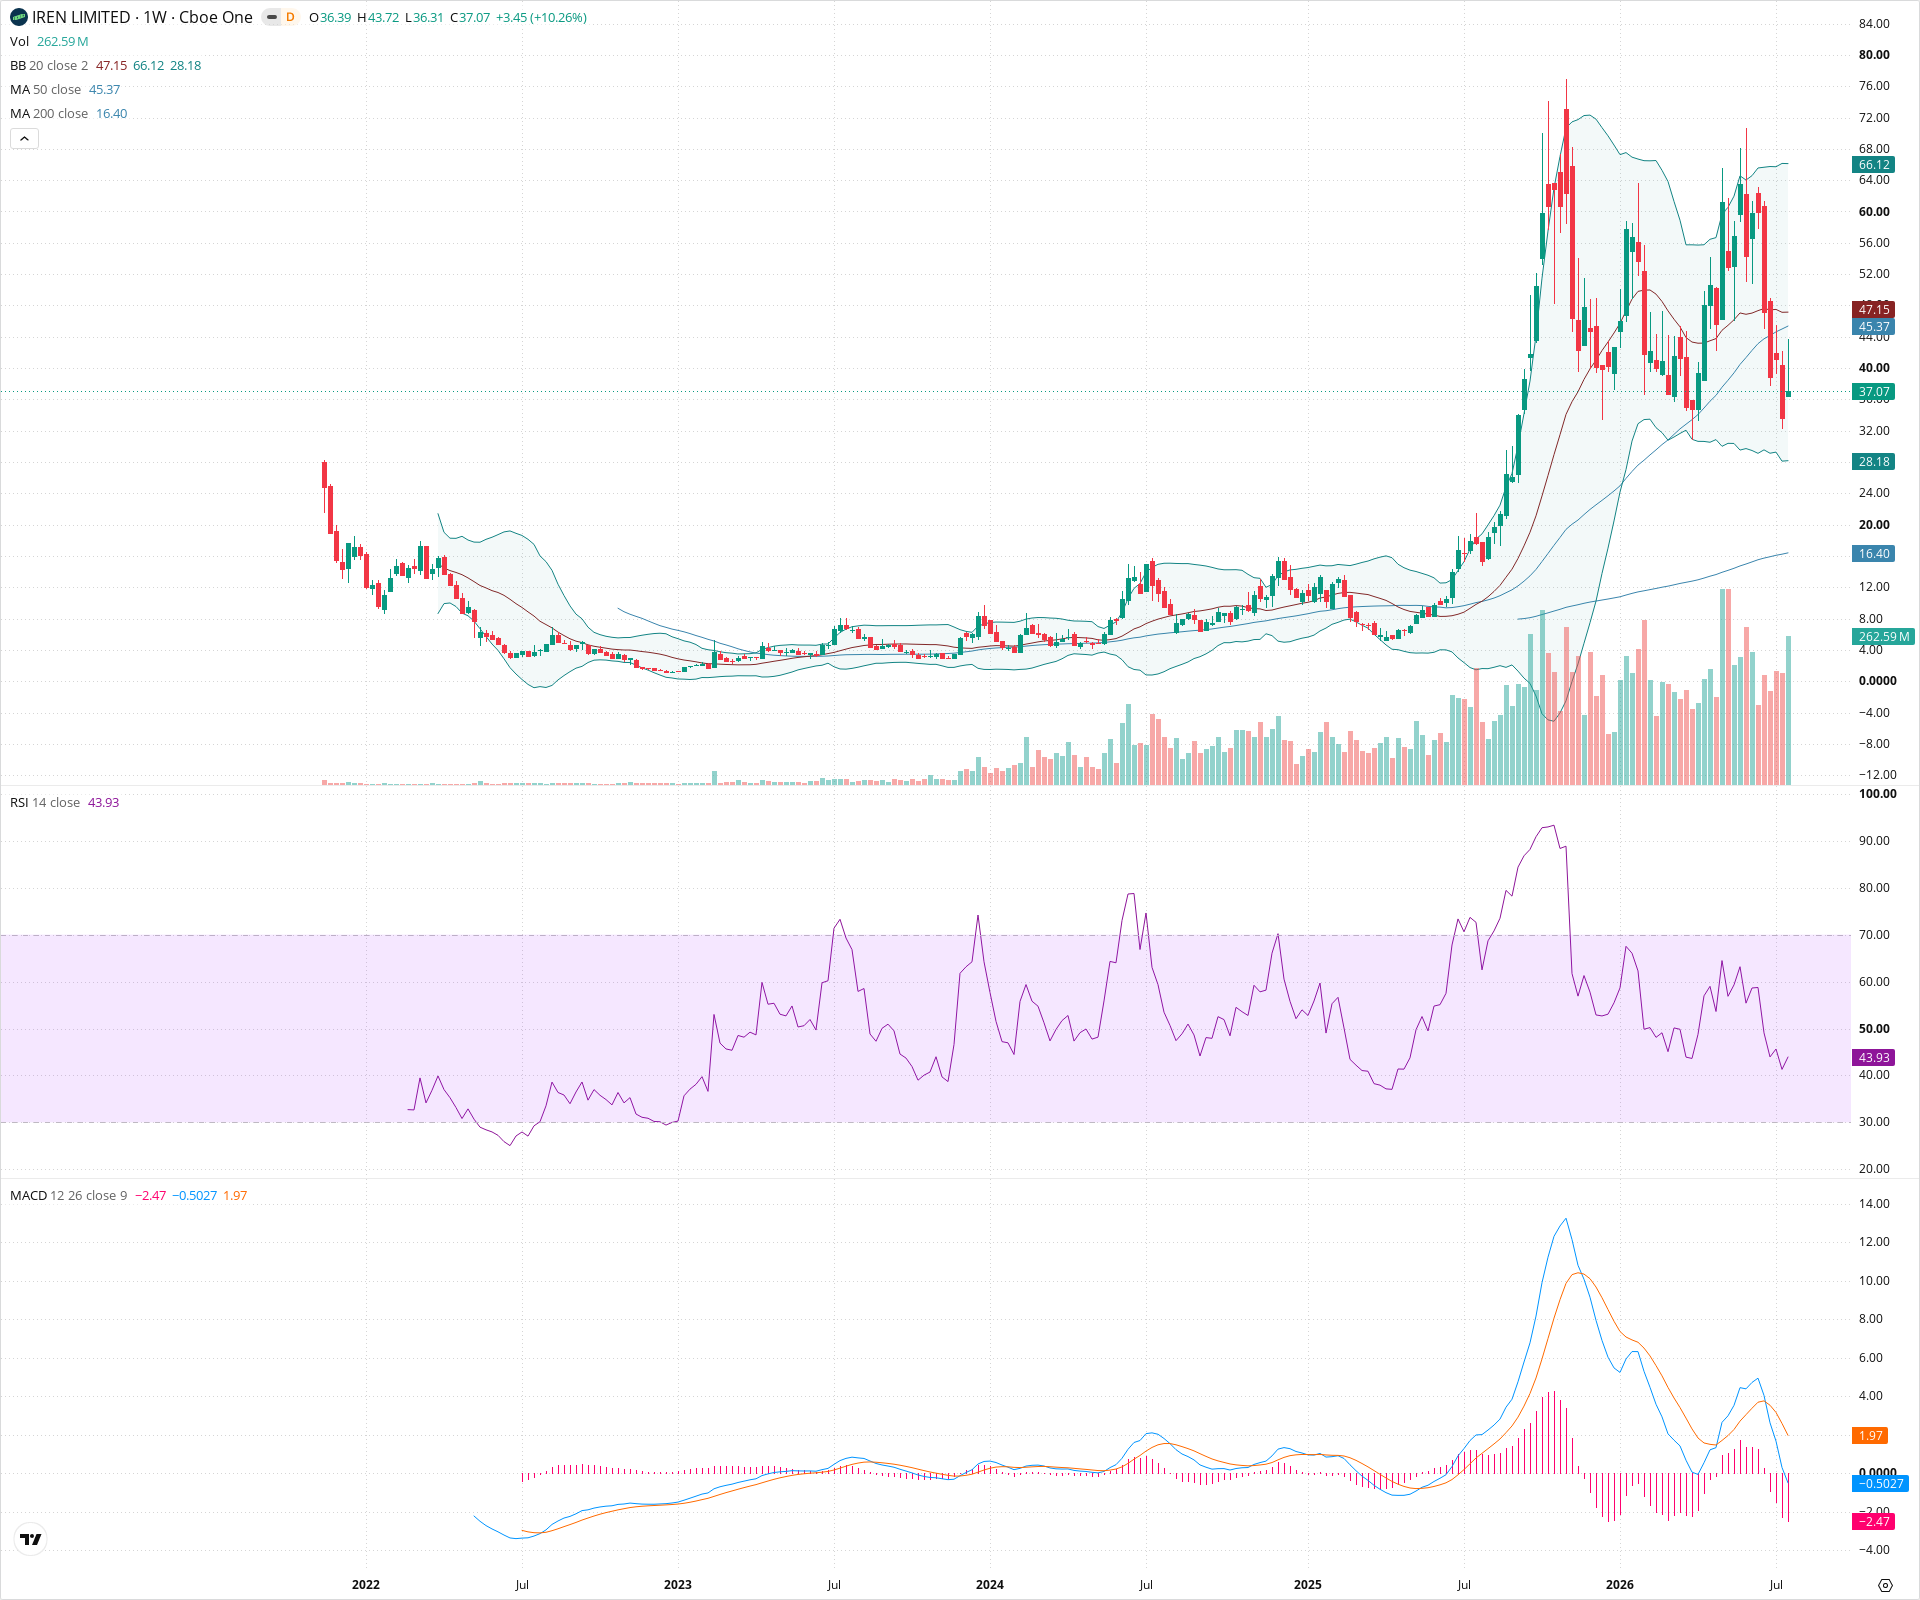
IREN Weekly Technical Analysis
Iris Energy Ltd
Bitcoin miner focusing on renewable energy-powered operations.
IREN Technical Analysis Summary
IREN is currently undergoing a drastic mean-reversion phase following a spectacular parabolic blow-off top. Short-term momentum is heavily bearish as price has sliced through the 50-week SMA accompanied by decisively negative MACD cross and histogram readings. However, from a long-term perspective, this violent correction is occurring within a broader macro uptrend, with price remaining well above the foundational 200-week SMA. The key technical test will be whether the asset can establish a higher low and stabilize near the $20-$30 historical support zones.
Included In Lists
Related Tickers of Interest
IREN Weekly Chart
Sentiment
Short-term Sentiment (days to weeks): Bearish
Price is in a sharp multi-week downtrend, having broken definitively below the 50-week SMA. This is confirmed by a deeply negative and expanding MACD histogram, and an RSI that has fallen below the 50 midline.
Long-term Sentiment (weeks to months): Bullish
Despite the severe recent correction, the overarching macro structure remains an uptrend following a massive breakout. The price is still trading significantly above a rising 200-week SMA.
Report Metadata
- Timeframe: weekly
- Generated at: 2026-07-25T09:07:14.099Z
- Model: gemini-3.1-pro-preview
Support Price Levels
| Level | Range | Strength | Notes |
|---|---|---|---|
| $30.00 | $28.00 - $32.00 | Weak | Immediate downside area defined by the current position of the lower Bollinger Band and a minor prior swing low during the descent. |
| $22.00 | $20.00 - $24.00 | Strong | Significant prior consolidation zone that acted as a launching pad for the final parabolic acceleration. Likely to offer substantial structural support. |
Resistance Price Levels
| Level | Range | Strength | Notes |
|---|---|---|---|
| $47.00 | $45.00 - $49.00 | Strong | Major confluence zone consisting of the recently broken 50-week SMA, the 20-week SMA (Bollinger Band midline), and recent swing highs on the way down. |
| $63.00 | $60.00 - $66.00 | Strong | A distinct lower high formed during the initial stages of the reversal, located near the current upper Bollinger Band. |
Potential Chart Patterns in Formation
| Strength | Pattern | Signal | Target | Details |
|---|---|---|---|---|
| Strong | Blow-Off Top and Mean Reversion | Bearish | N/A | Following an extreme, nearly vertical parabolic advance to structural highs, the asset has entered a severe, high-momentum mean reversion phase characterized by rapid price depreciation back toward longer-term averages. |
Frequently Asked Questions about IREN
What is the current sentiment for IREN?
The short-term sentiment for IREN is currently Bearish because Price is in a sharp multi-week downtrend, having broken definitively below the 50-week SMA. This is confirmed by a deeply negative and expanding MACD histogram, and an RSI that has fallen below the 50 midline.. The long-term trend is classified as Bullish.
What are the key support levels for IREN?
StockDips.AI has identified key support levels for IREN at $30.00 and $22.00. These levels may represent potential accumulation zones where buying interest could emerge.
Is IREN in a significant dip or a Value Dip right now?
IREN has a Value Score of 62/100. It is not currently flagged as a significant dip in the Top Dips list. It is not listed as a Value Dip because the long-term sentiment or value-score threshold does not qualify.
View the full interactive analysis on StockDips.AI.