KEEL Daily Technical Analysis
Keel Infrastructure Corp (formerly Bitfarms)
Bitcoin mining, High-Performance Computing (HPC) and Artificial Intelligence (AI) infrastructure
KEEL Technical Analysis Summary
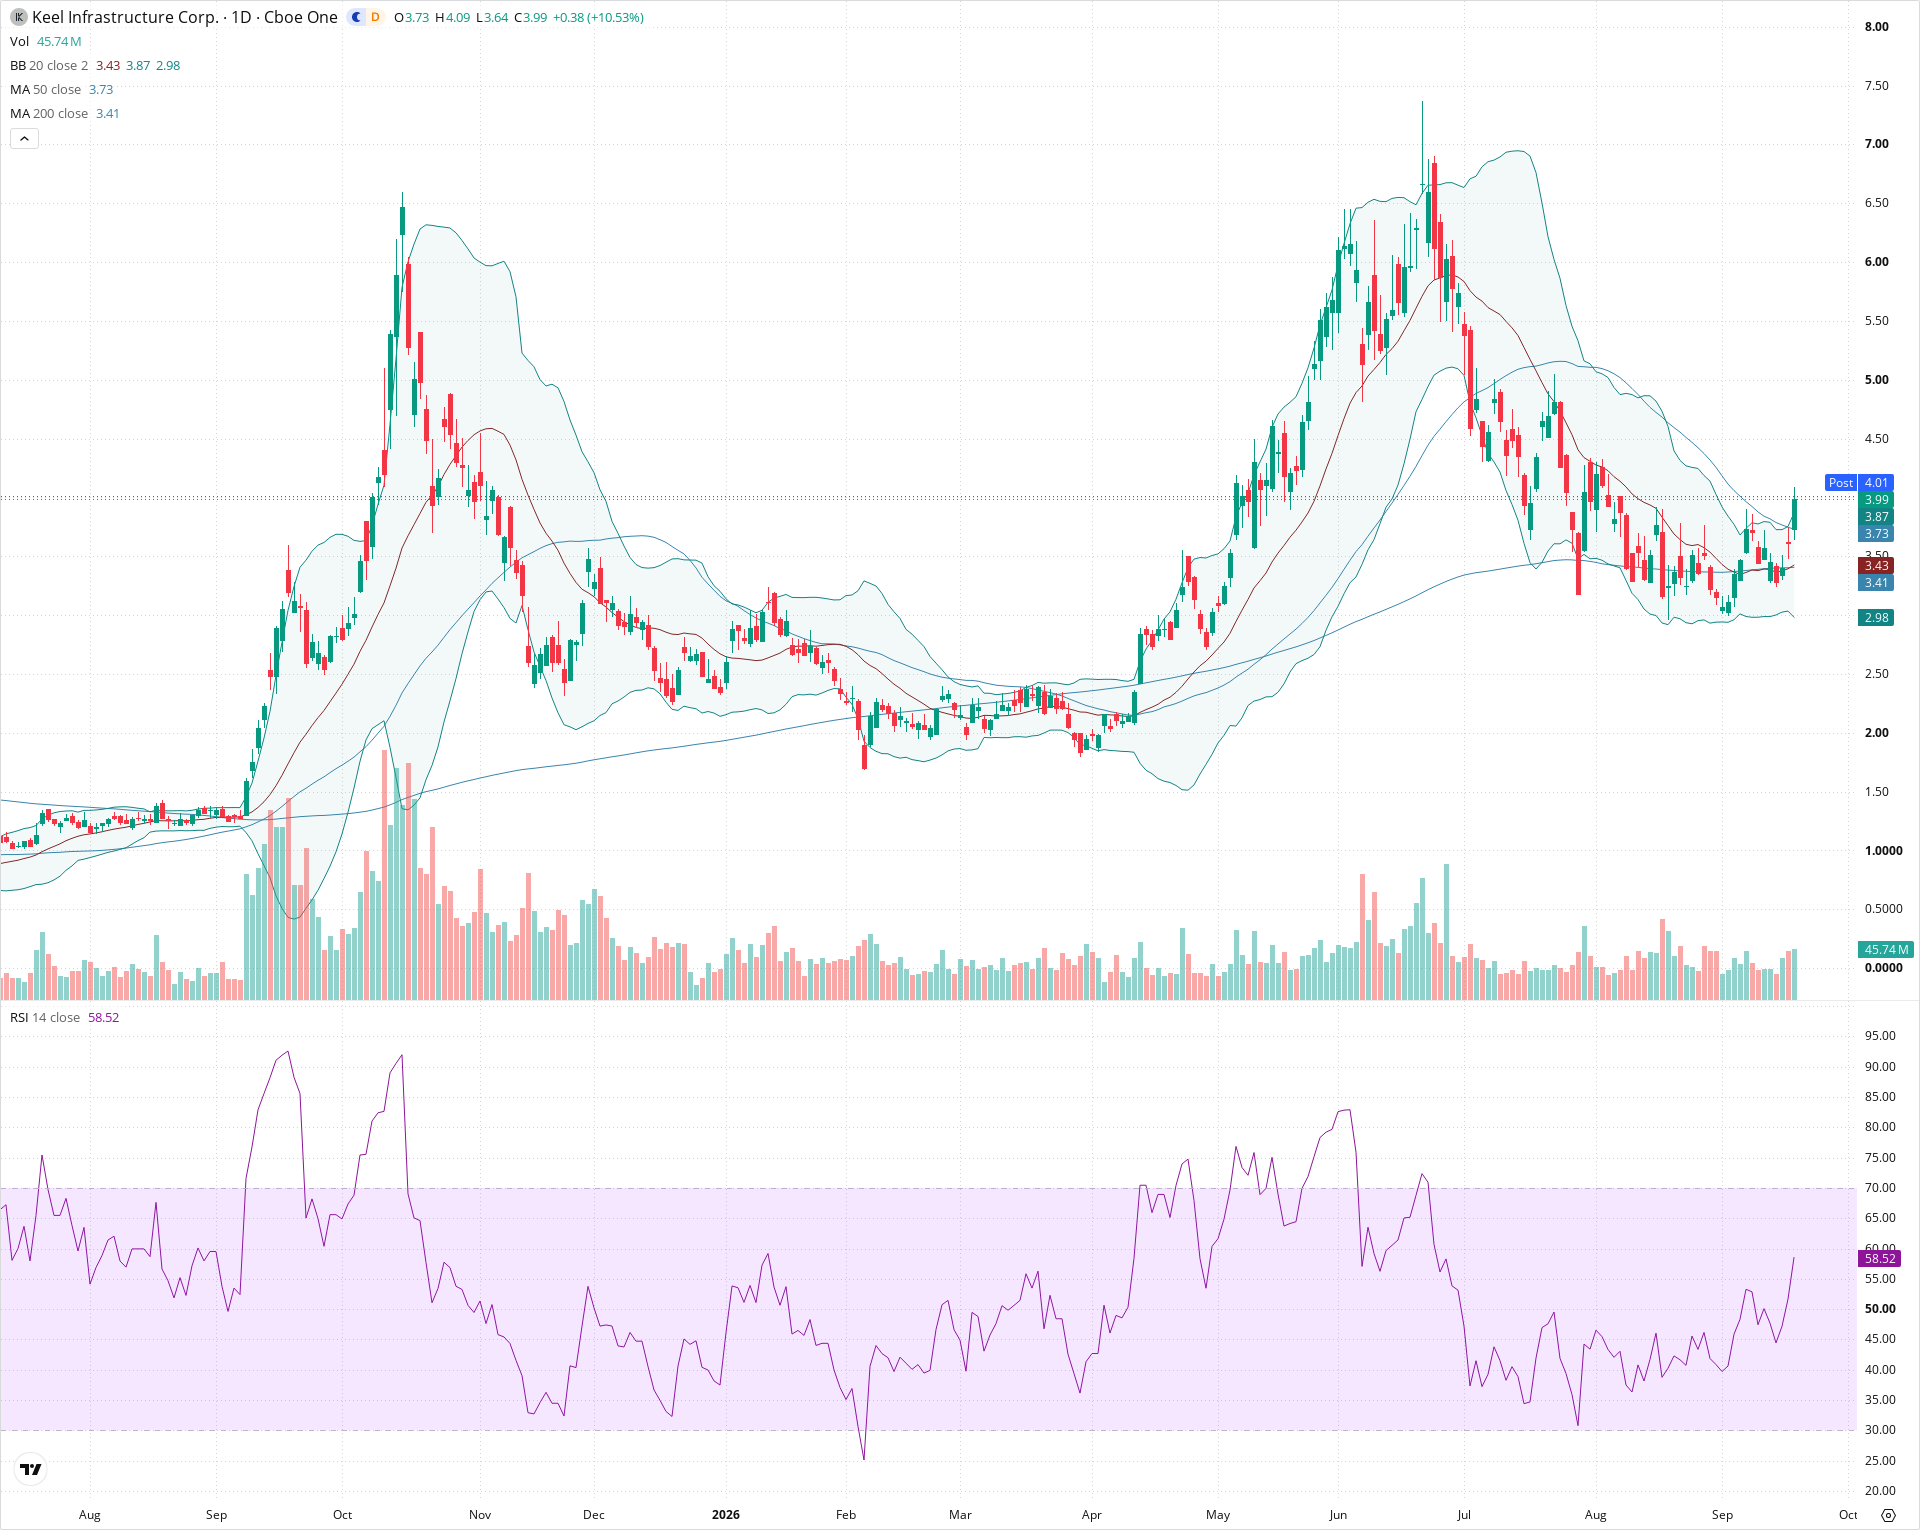
KEEL is displaying strong signs of bottoming after a protracted pullback from summer highs, successfully holding and bouncing from its 200-day SMA near 3.41. The breakout above the 50-day SMA and upper Bollinger Band confirms renewed buyer interest supported by rising volume and an advancing RSI. For long-term investors, confirmation above the 4.10-4.35 zone is required to establish a sustained trend reversal toward the 5.00 structural resistance.
Included In Lists
Related Tickers of Interest
KEEL Daily Chart
Sentiment
Short-term Sentiment (days to weeks): Bullish
Price surged over 10% on expanding volume, clearing the 20-day and 50-day moving averages and piercing above the upper Bollinger Band with RSI rising toward 58.5.
Long-term Sentiment (weeks to months): Neutral
Although the 50-day MA remains above the upward-sloping 200-day MA, price is recovering from a steep multi-month decline off the 7.40 highs and faces overhead supply.
Report Metadata
- Timeframe: daily
- Generated at: 2026-09-18T20:22:12.142Z
- Model: gemini-3.8-flash
Support Price Levels
| Level | Range | Strength | Notes |
|---|---|---|---|
| $3.43 | $3.40 - $3.45 | Strong | Confluence of the rising 200-day SMA (3.41) and the 20-day SMA (3.43), which served as recent base support. |
| $3.18 | $3.10 - $3.25 | Strong | Key horizontal floor established by the August and September consolidation lows. |
Resistance Price Levels
| Level | Range | Strength | Notes |
|---|---|---|---|
| $4.23 | $4.10 - $4.35 | Moderate | Current session high and swing highs from early August prior to the late-summer pullback. |
| $5.03 | $4.90 - $5.15 | Strong | Major distribution zone and prior breakdown support from July. |
Potential Chart Patterns in Formation
| Strength | Pattern | Signal | Target | Details |
|---|---|---|---|---|
| Moderate | Double Bottom | Bullish | $4.75 | A base formed across August and September near 3.15-3.20, breaking out above the 3.85 neckline on strong volume. |
| Moderate | Bollinger Band Breakout | Bullish | N/A | Candle closing above the upper Bollinger Band following a period of band contraction, indicating expanding upside volatility. |
Frequently Asked Questions about KEEL
What is the current sentiment for KEEL?
The short-term sentiment for KEEL is currently Bullish because Price surged over 10% on expanding volume, clearing the 20-day and 50-day moving averages and piercing above the upper Bollinger Band with RSI rising toward 58.5.. The long-term trend is classified as Neutral.
What are the key support levels for KEEL?
StockDips.AI has identified key support levels for KEEL at $3.43 and $3.18. These levels may represent potential accumulation zones where buying interest could emerge.
Is KEEL in a significant dip or a Value Dip right now?
KEEL has a Value Score of 27/100. It is not currently flagged as a significant dip in the Top Dips list. It is not listed as a Value Dip because the long-term sentiment or value-score threshold does not qualify.
View the full interactive analysis on StockDips.AI.