TGT Daily Technical Analysis
Target Corporation
Large U.S. retail chain offering general merchandise, apparel, home goods, groceries, and essentials through 1,900+ stores and a strong omni-channel platform.
TGT Technical Analysis Summary
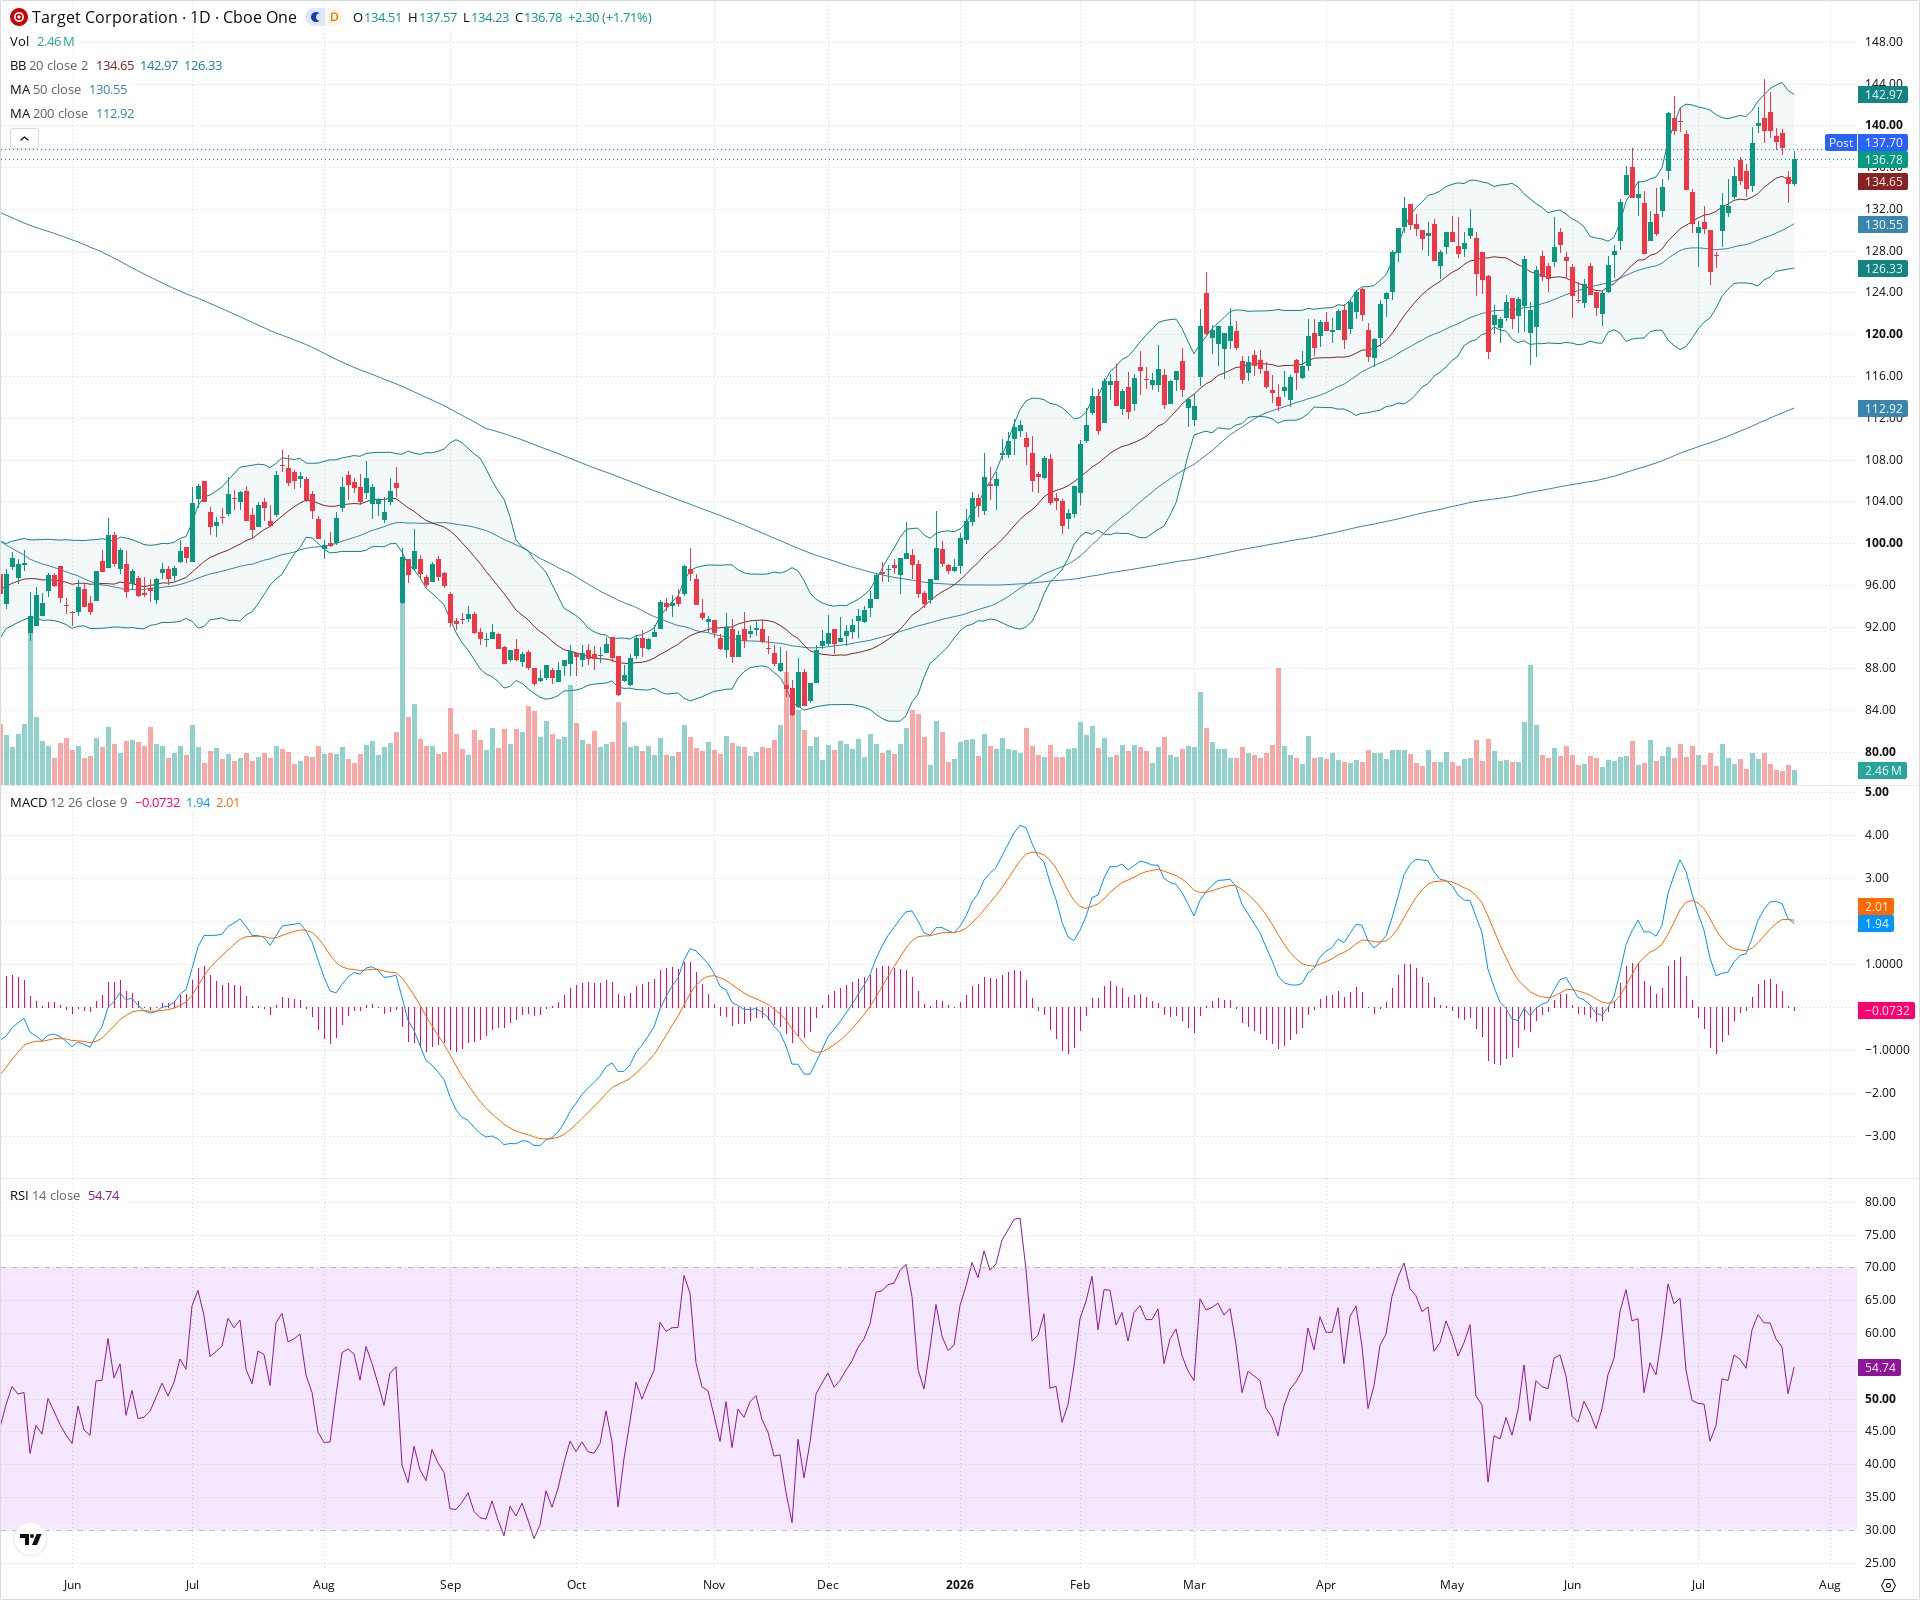
TGT remains in a strong long-term uptrend, characterized by a series of higher highs and higher lows above rising key moving averages. Currently, the stock is experiencing a healthy short-term consolidation phase after encountering resistance near the $144 level. Momentum indicators like the MACD and RSI are cooling off, suggesting a temporary pause, but the broader technical structure remains firmly bullish for long-term investors.
Included In Lists
Related Tickers of Interest
TGT Daily Chart
Sentiment
Short-term Sentiment (days to weeks): Neutral
Price is consolidating after a recent high near $144. Momentum is cooling in the short term, evidenced by a bearish MACD crossover and a negative histogram, while RSI has pulled back from near-overbought levels to the mid-50s.
Long-term Sentiment (weeks to months): Bullish
The stock is in a clear, sustained uptrend with higher highs and higher lows. It is trading comfortably above both an ascending 50-day SMA and 200-day SMA, with a long-standing Golden Cross in effect.
Report Metadata
- Timeframe: daily
- Generated at: 2026-07-24T21:09:57.401Z
- Model: gemini-3.1-pro-preview
Support Price Levels
| Level | Range | Strength | Notes |
|---|---|---|---|
| $131.00 | $130.00 - $132.00 | Strong | Aligns with the rising 50-day SMA and recent minor swing lows during the current uptrend. |
| $122.00 | $120.00 - $124.00 | Strong | A previous area of consolidation and structural support from earlier in the year. |
Resistance Price Levels
| Level | Range | Strength | Notes |
|---|---|---|---|
| $144.00 | $143.00 - $145.00 | Strong | The most recent prominent swing high and visual upper boundary of the current price action. |
Potential Chart Patterns in Formation
| Strength | Pattern | Signal | Target | Details |
|---|---|---|---|---|
| Strong | Golden Cross | Bullish | N/A | The 50-day SMA crossed above the 200-day SMA earlier in the chart's history, signaling the start of the current long-term bullish trend. |
Frequently Asked Questions about TGT
What is the current sentiment for TGT?
The short-term sentiment for TGT is currently Neutral because Price is consolidating after a recent high near $144. Momentum is cooling in the short term, evidenced by a bearish MACD crossover and a negative histogram, while RSI has pulled back from near-overbought levels to the mid-50s.. The long-term trend is classified as Bullish.
What are the key support levels for TGT?
StockDips.AI has identified key support levels for TGT at $131.00 and $122.00. These levels may represent potential accumulation zones where buying interest could emerge.
Is TGT in a significant dip or a Value Dip right now?
TGT has a Value Score of 56/100. It is not currently flagged as a significant dip in the Top Dips list. It is not listed as a Value Dip because the long-term sentiment or value-score threshold does not qualify.
View the full interactive analysis on StockDips.AI.