NKE Daily Technical Analysis
Nike Inc
Designs and markets athletic footwear, apparel, and equipment worldwide.
This is a historical daily technical analysis report for NKE, generated on June 2, 2026 at 2:10 PM UTC.
NKE Technical Analysis Summary
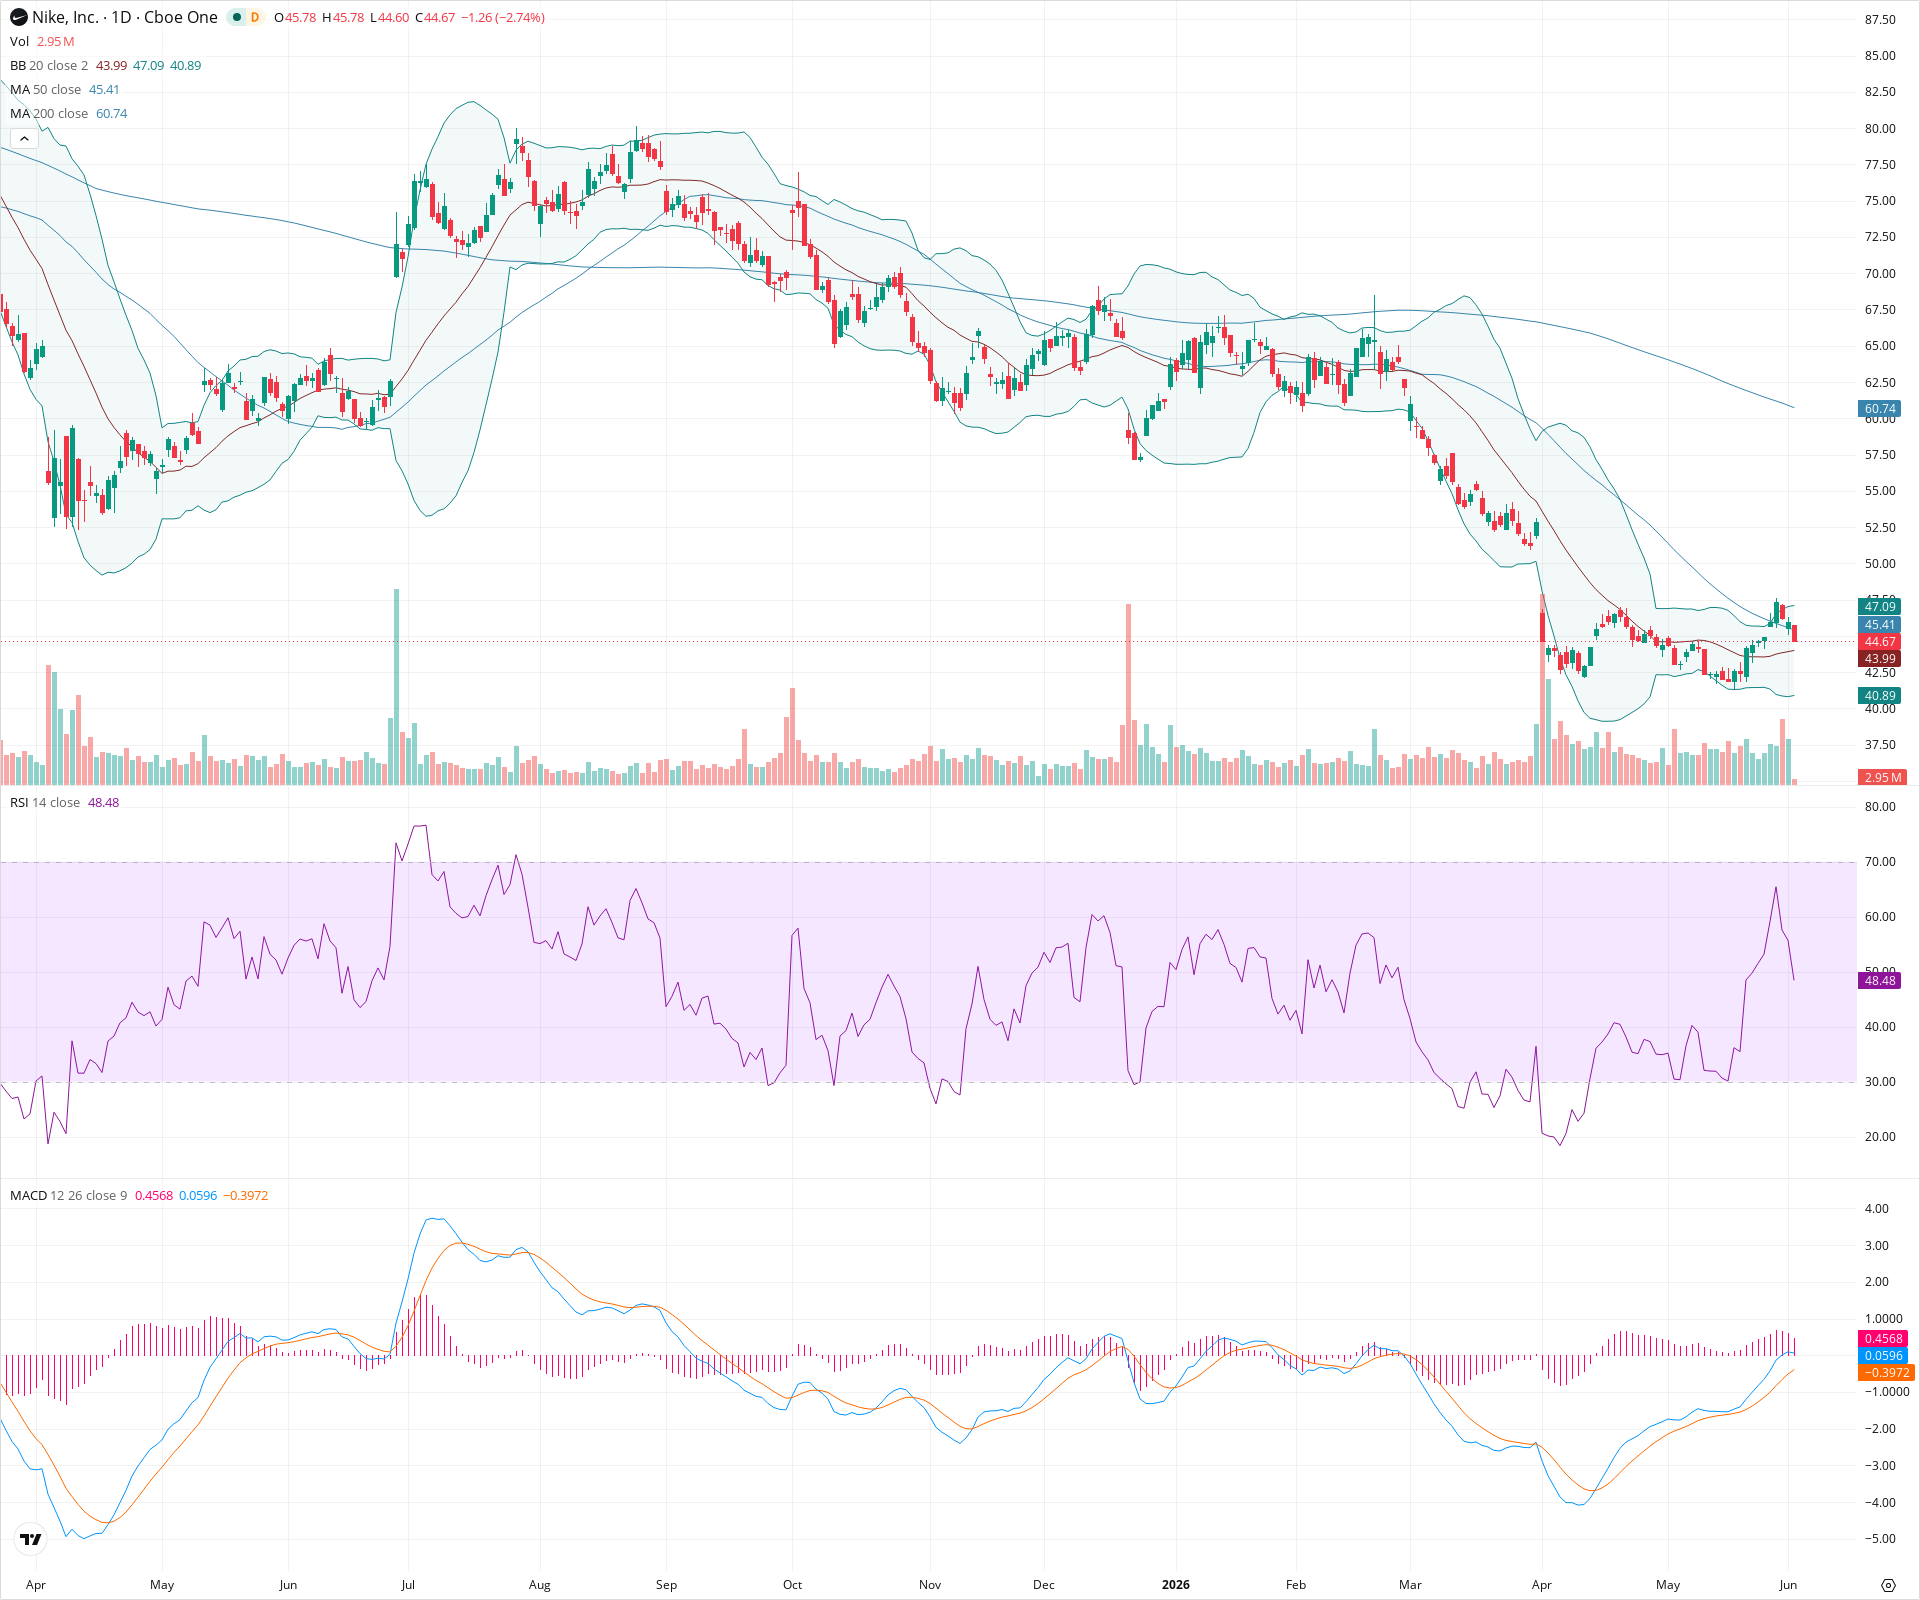
NKE remains entrenched in a severe long-term downtrend, defined by its position far below a declining 200-day SMA and a massive unfilled gap overhead. However, the short-term picture shows an attempt at stabilization as the stock builds a base between 40 and 47. Until a decisive breakout occurs from this consolidation range, near-term price action is likely to remain choppy and neutral.
Included In Lists
Related Tickers of Interest
Historical Report Navigation
Browse adjacent archived reports or jump back to the latest live analysis page.
NKE Daily Chart
Sentiment
Short-term Sentiment (days to weeks): Neutral
Price is currently consolidating in a range, trapped between the rising 20-day SMA acting as short-term support and the 50-day SMA acting as overhead resistance. RSI is hovering near the neutral 50 level, and MACD upward momentum is showing signs of flattening.
Long-term Sentiment (weeks to months): Bearish
The stock remains in a dominant long-term downtrend, trading significantly below a steeply declining 200-day SMA. The technical picture is heavily weighed down by a massive, high-volume gap down that has yet to be filled.
Report Metadata
- Timeframe: daily
- Generated at: Jun 2, 2026
- Model: gemini-3.1-pro-preview
Support Price Levels
| Level | Range | Strength | Notes |
|---|---|---|---|
| $43.50 | $43.00 - $44.00 | Weak | Immediate support zone encompassing the 20-day SMA (currently near 44.00) and minor recent consolidation. |
| $40.50 | $40.00 - $41.00 | Strong | Major swing low established after the significant gap down; acts as the floor of the current base-building attempt. |
Resistance Price Levels
| Level | Range | Strength | Notes |
|---|---|---|---|
| $46.45 | $45.40 - $47.50 | Strong | Significant near-term resistance band containing the 50-day SMA, the upper Bollinger Band, and recent swing highs. |
| $51.00 | $50.00 - $52.00 | Strong | The bottom edge of the massive unfilled gap down, representing a major overhead supply zone. |
Potential Chart Patterns in Formation
| Strength | Pattern | Signal | Target | Details |
|---|---|---|---|---|
| Strong | Consolidation Range | Neutral | N/A | Following a sharp decline, price has been trading in a relatively sideways range between roughly 40 and 47 for an extended period, attempting to form a base. |
| Strong | Bearish Gap Down | Bearish | N/A | A prominent, high-volume gap down visible earlier in the chart sequence, creating a large void in price action that serves as heavy long-term structural resistance. |
Frequently Asked Questions about NKE
What is the current sentiment for NKE?
The short-term sentiment for NKE is currently Neutral because Price is currently consolidating in a range, trapped between the rising 20-day SMA acting as short-term support and the 50-day SMA acting as overhead resistance. RSI is hovering near the neutral 50 level, and MACD upward momentum is showing signs of flattening. The long-term trend is classified as Bearish.
What are the key support levels for NKE?
StockDips.AI has identified key support levels for NKE at $43.50 and $40.50. These levels may represent potential accumulation zones where buying interest could emerge.
Is NKE in a significant dip or a Value Dip right now?
NKE has a Value Score of 96/100. It is currently flagged as a significant dip in the Top Dips list. It is not listed as a Value Dip because the long-term sentiment or value-score threshold does not qualify.
View the full interactive analysis on StockDips.AI.