NVO Daily Technical Analysis
Novo Nordisk A/S
Danish pharma specializing in diabetes and weight-loss drugs such as Ozempic and Wegovy.
This is a historical daily technical analysis report for NVO, generated on July 24, 2026 at 9:11 PM UTC.
NVO Technical Analysis Summary
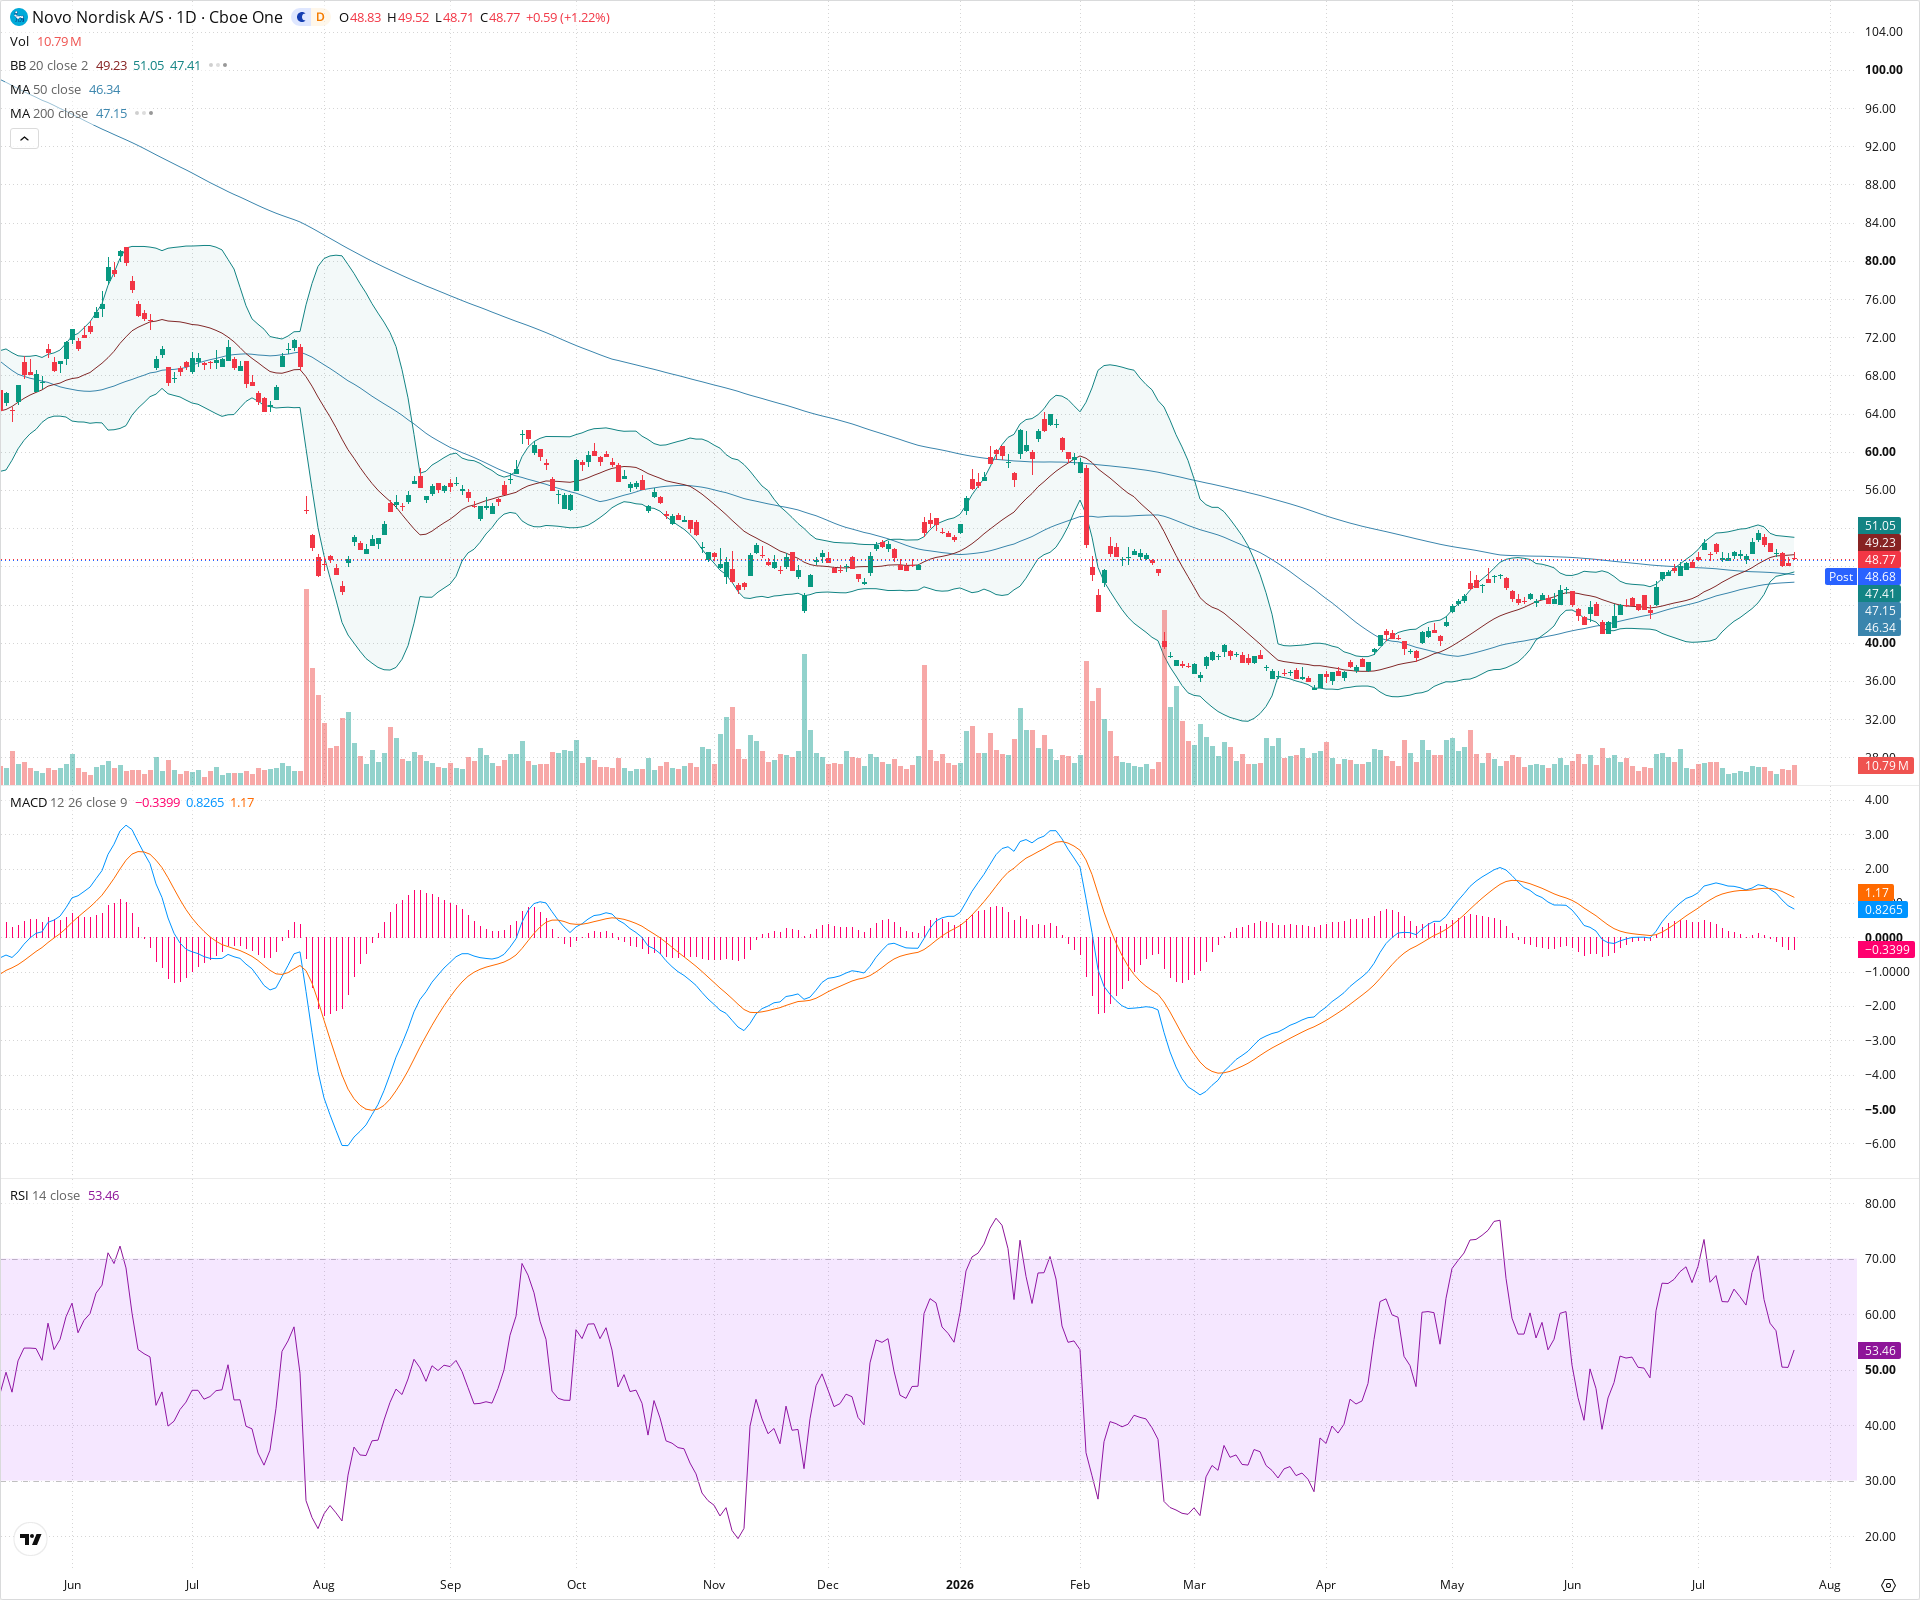
NVO is demonstrating a strong technical turnaround, transitioning from a prolonged downtrend into a new accumulation and markup phase characterized by a rounding bottom. The stock has successfully reclaimed key moving averages, and the impending 50/200-day SMA Golden Cross suggests a significant positive shift in long-term momentum. As long as price maintains structure above the 46-47 support cluster, the technical bias remains constructive for further upside.
Included In Lists
Related Tickers of Interest
Historical Report Navigation
Browse adjacent archived reports or jump back to the latest live analysis page.
NVO Daily Chart
Sentiment
Short-term Sentiment (days to weeks): Bullish
Price is maintaining a steady uptrend, consistently forming higher highs and higher lows. It is trading above the rising 20-day and 50-day SMAs. The MACD line remains above the signal line and the zero line, confirming upward momentum, though the histogram is showing slight contraction.
Long-term Sentiment (weeks to months): Bullish
The chart shows a major structural reversal. After a steep decline, price formed a long consolidation base and has now broken upwards, reclaiming the 200-day SMA. The 50-day SMA is rising sharply and appears to be on the verge of crossing above the 200-day SMA, which would trigger a long-term bullish 'Golden Cross' signal.
Report Metadata
- Timeframe: daily
- Generated at: Jul 24, 2026
- Model: gemini-3.1-pro-preview
Support Price Levels
| Level | Range | Strength | Notes |
|---|---|---|---|
| $46.90 | $46.30 - $47.50 | Strong | A critical confluence zone containing the rising 50-day SMA, the 200-day SMA, and the 20-day SMA, acting as dynamic support for the current uptrend. |
| $41.00 | $40.00 - $42.00 | Strong | A significant structural swing low area formed prior to the recent bullish leg up. |
| $37.00 | $36.00 - $38.00 | Strong | The major chart bottom and long-term consolidation floor. |
Resistance Price Levels
| Level | Range | Strength | Notes |
|---|---|---|---|
| $50.75 | $50.00 - $51.50 | Weak | Immediate overhead resistance near psychological round numbers and the upper Bollinger Band, where price has recently paused. |
| $60.00 | $58.00 - $62.00 | Strong | A major previous lower high formed during a relief rally after the initial large sell-off on the left side of the chart. |
Potential Chart Patterns in Formation
| Strength | Pattern | Signal | Target | Details |
|---|---|---|---|---|
| Strong | Rounding Bottom | Bullish | N/A | The macro structure of the chart shows a long, U-shaped recovery from a severe downtrend, indicating a slow but steady shift from distribution to accumulation. |
| Strong | Golden Cross (Developing) | Bullish | N/A | The 50-day SMA is rising steeply towards the flattening 200-day SMA. A crossover appears imminent, which is a classic long-term bullish trend continuation signal. |
Frequently Asked Questions about NVO
What is the current sentiment for NVO?
The short-term sentiment for NVO is currently Bullish because Price is maintaining a steady uptrend, consistently forming higher highs and higher lows. It is trading above the rising 20-day and 50-day SMAs. The MACD line remains above the signal line and the zero line, confirming upward momentum, though the histogram is showing slight contraction. The long-term trend is classified as Bullish.
What are the key support levels for NVO?
StockDips.AI has identified key support levels for NVO at $46.90 and $41.00. These levels may represent potential accumulation zones where buying interest could emerge.
Is NVO in a significant dip or a Value Dip right now?
NVO has a Value Score of 80/100. It is currently flagged as a significant dip in the Top Dips list. It is also listed as a Value Dip because long-term sentiment is bullish.
View the full interactive analysis on StockDips.AI.