ORCL Daily Technical Analysis
Oracle Corporation
A global enterprise software and cloud infrastructure provider offering databases, ERP systems, and cloud services. Known for its mission-critical business software and rapidly growing Oracle Cloud Infrastructure (OCI).
This is a historical daily technical analysis report for ORCL, generated on September 18, 2026 at 8:18 PM UTC.
ORCL Technical Analysis Summary
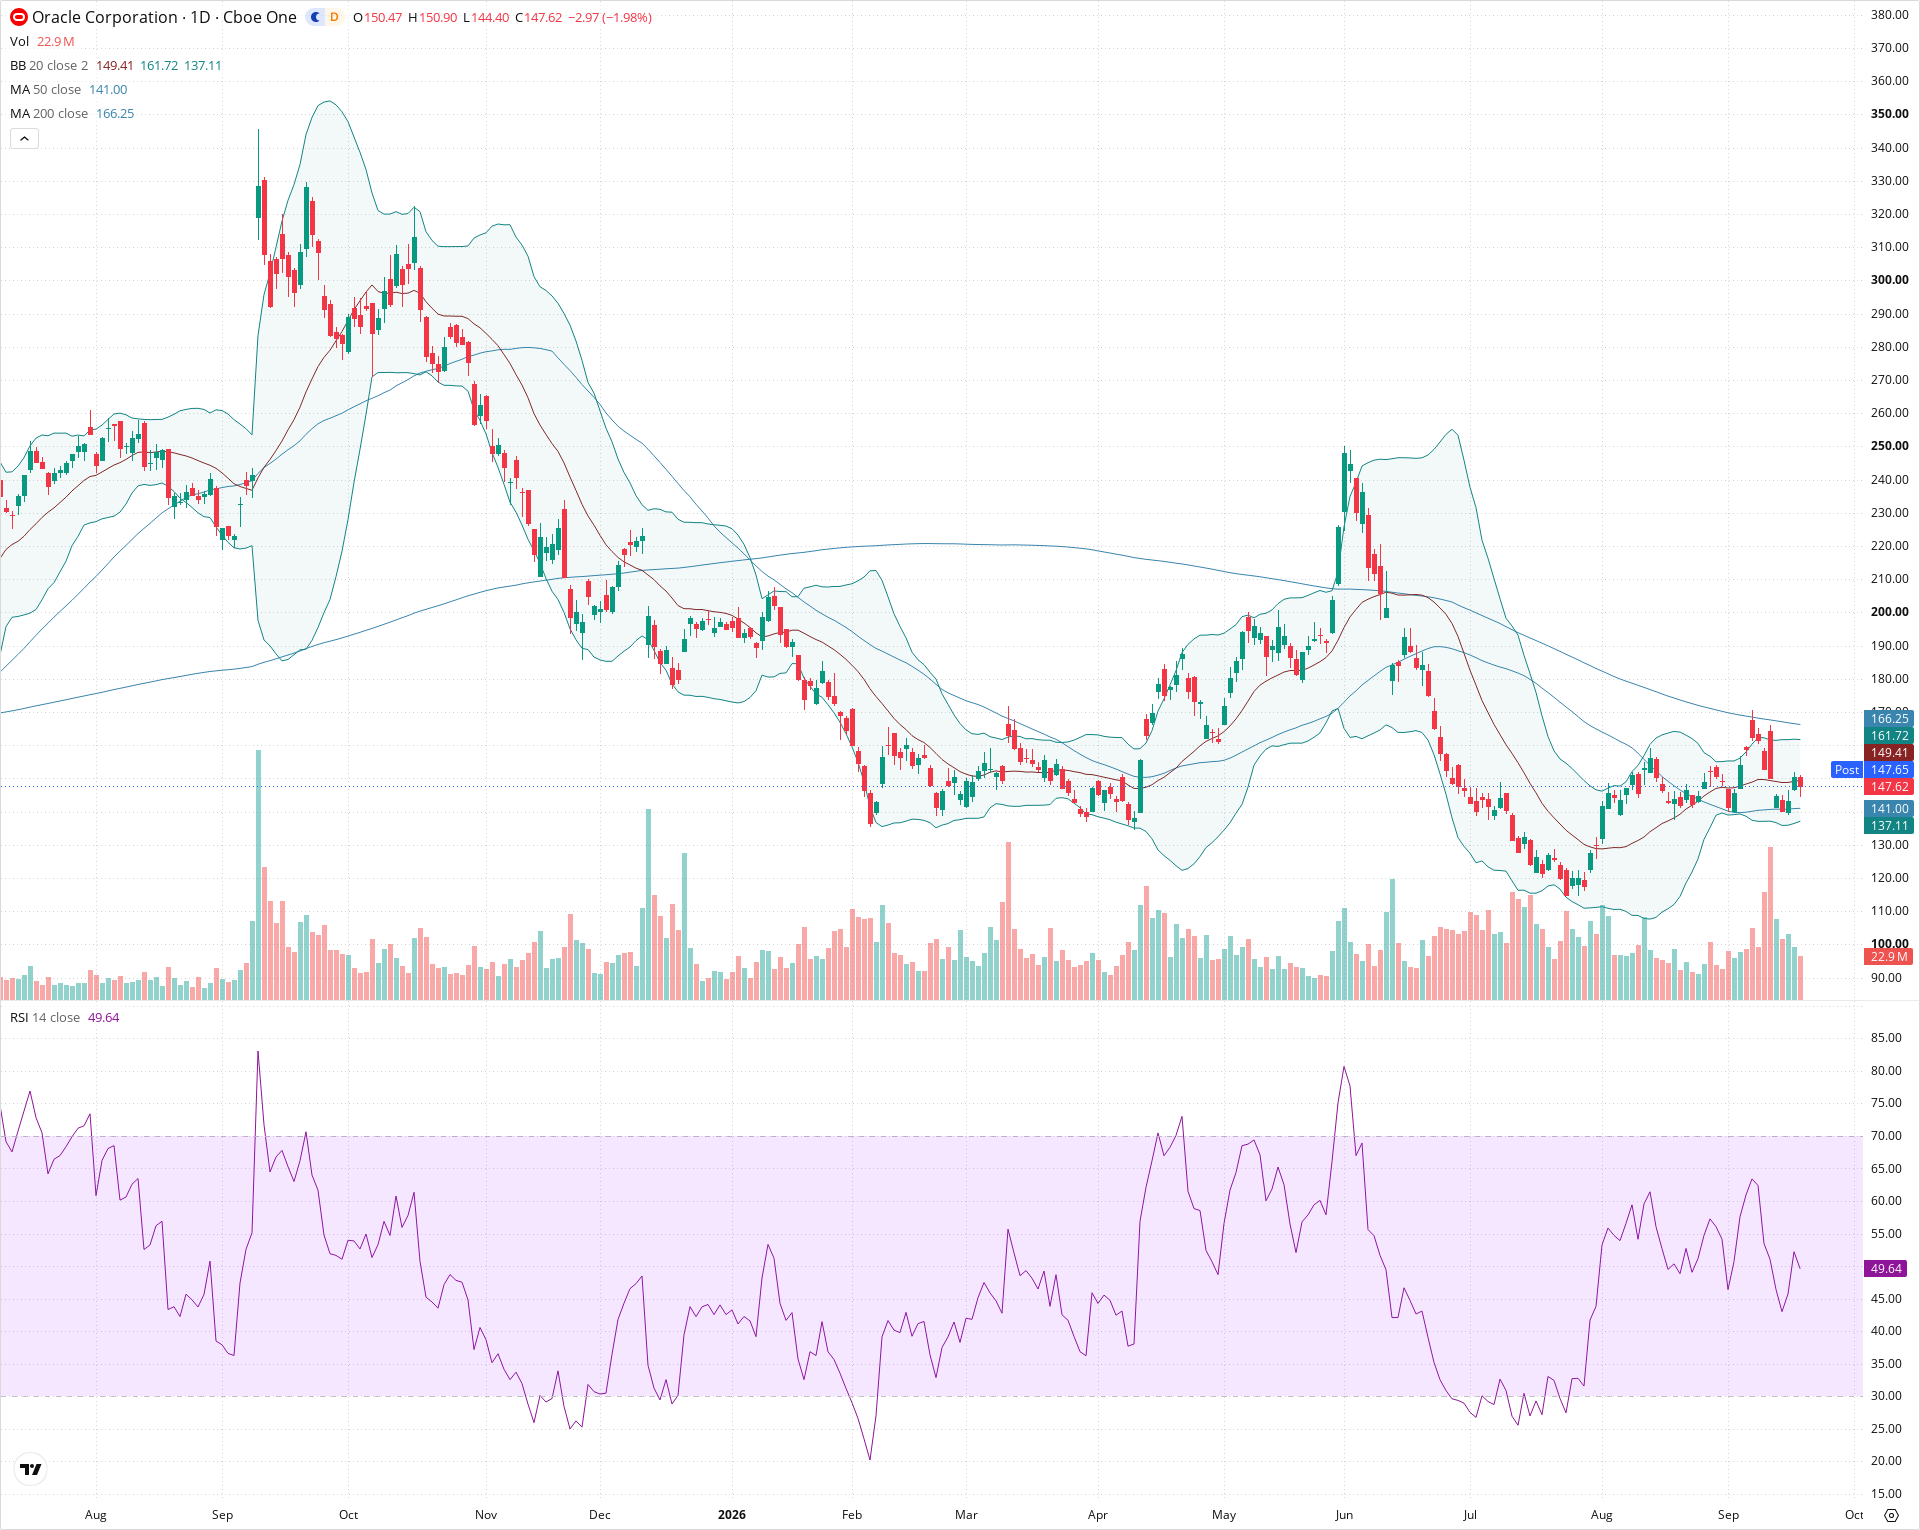
ORCL recently staged a recovery off its multi-month lows around 115-120, successfully clearing its 50-day SMA before encountering firm resistance at its descending 200-day SMA near 166.25. The broader primary trend remains bearish with moving averages in a negative alignment, though short-term price action has stabilized into a neutral consolidation range between 140 and 165. For long-term investors, confirmation of a true trend reversal requires a decisive close above the 200-day moving average, whereas a break below the 140-141 support zone would indicate a resumption of the broader downward trajectory.
Included In Lists
Related Tickers of Interest
Historical Report Navigation
Browse adjacent archived reports or jump back to the latest live analysis page.
ORCL Daily Chart
Sentiment
Short-term Sentiment (days to weeks): Neutral
Price is consolidating between the 50-day and 200-day moving averages, currently hovering near the 20-day SMA with RSI flat near the neutral 50 level.
Long-term Sentiment (weeks to months): Bearish
The 50-day SMA remains well below the downward-sloping 200-day SMA, and the broader macro price structure reflects a sustained series of lower highs and lower lows.
Report Metadata
- Timeframe: daily
- Generated at: Sep 18, 2026
- Model: gemini-3.8-flash
Support Price Levels
| Level | Range | Strength | Notes |
|---|---|---|---|
| $142.20 | $140.00 - $144.40 | Moderate | Confluence of recent local swing lows and the rising 50-day SMA around 141.00. |
| $118.50 | $115.00 - $122.00 | Strong | Major multi-week base and double bottom support established during July and August. |
Resistance Price Levels
| Level | Range | Strength | Notes |
|---|---|---|---|
| $164.25 | $161.50 - $167.00 | Strong | Recent September rejection zone aligned with the declining 200-day SMA (166.25) and upper Bollinger Band. |
| $196.00 | $190.00 - $202.00 | Moderate | Prior distribution shelf and horizontal breakdown area from May and June. |
Potential Chart Patterns in Formation
| Strength | Pattern | Signal | Target | Details |
|---|---|---|---|---|
| Moderate | Double Bottom | Bullish | $165.00 | Formed a reversal base in July and August around the 115-120 area, breaking above the 140 neckline before stalling near 166. |
| Moderate | Moving Average Rejection | Bearish | $141.00 | Price rallied into the declining 200-day SMA near 166.25 and faced clear selling pressure, turning back downward toward the middle band. |
Frequently Asked Questions about ORCL
What is the current sentiment for ORCL?
The short-term sentiment for ORCL is currently Neutral because Price is consolidating between the 50-day and 200-day moving averages, currently hovering near the 20-day SMA with RSI flat near the neutral 50 level. The long-term trend is classified as Bearish.
What are the key support levels for ORCL?
StockDips.AI has identified key support levels for ORCL at $142.20 and $118.50. These levels may represent potential accumulation zones where buying interest could emerge.
Is ORCL in a significant dip or a Value Dip right now?
ORCL has a Value Score of 94/100. It is currently flagged as a significant dip in the Top Dips list. It is not listed as a Value Dip because the long-term sentiment or value-score threshold does not qualify.
View the full interactive analysis on StockDips.AI.