ORCL Weekly Technical Analysis
Oracle Corporation
A global enterprise software and cloud infrastructure provider offering databases, ERP systems, and cloud services. Known for its mission-critical business software and rapidly growing Oracle Cloud Infrastructure (OCI).
ORCL Technical Analysis Summary
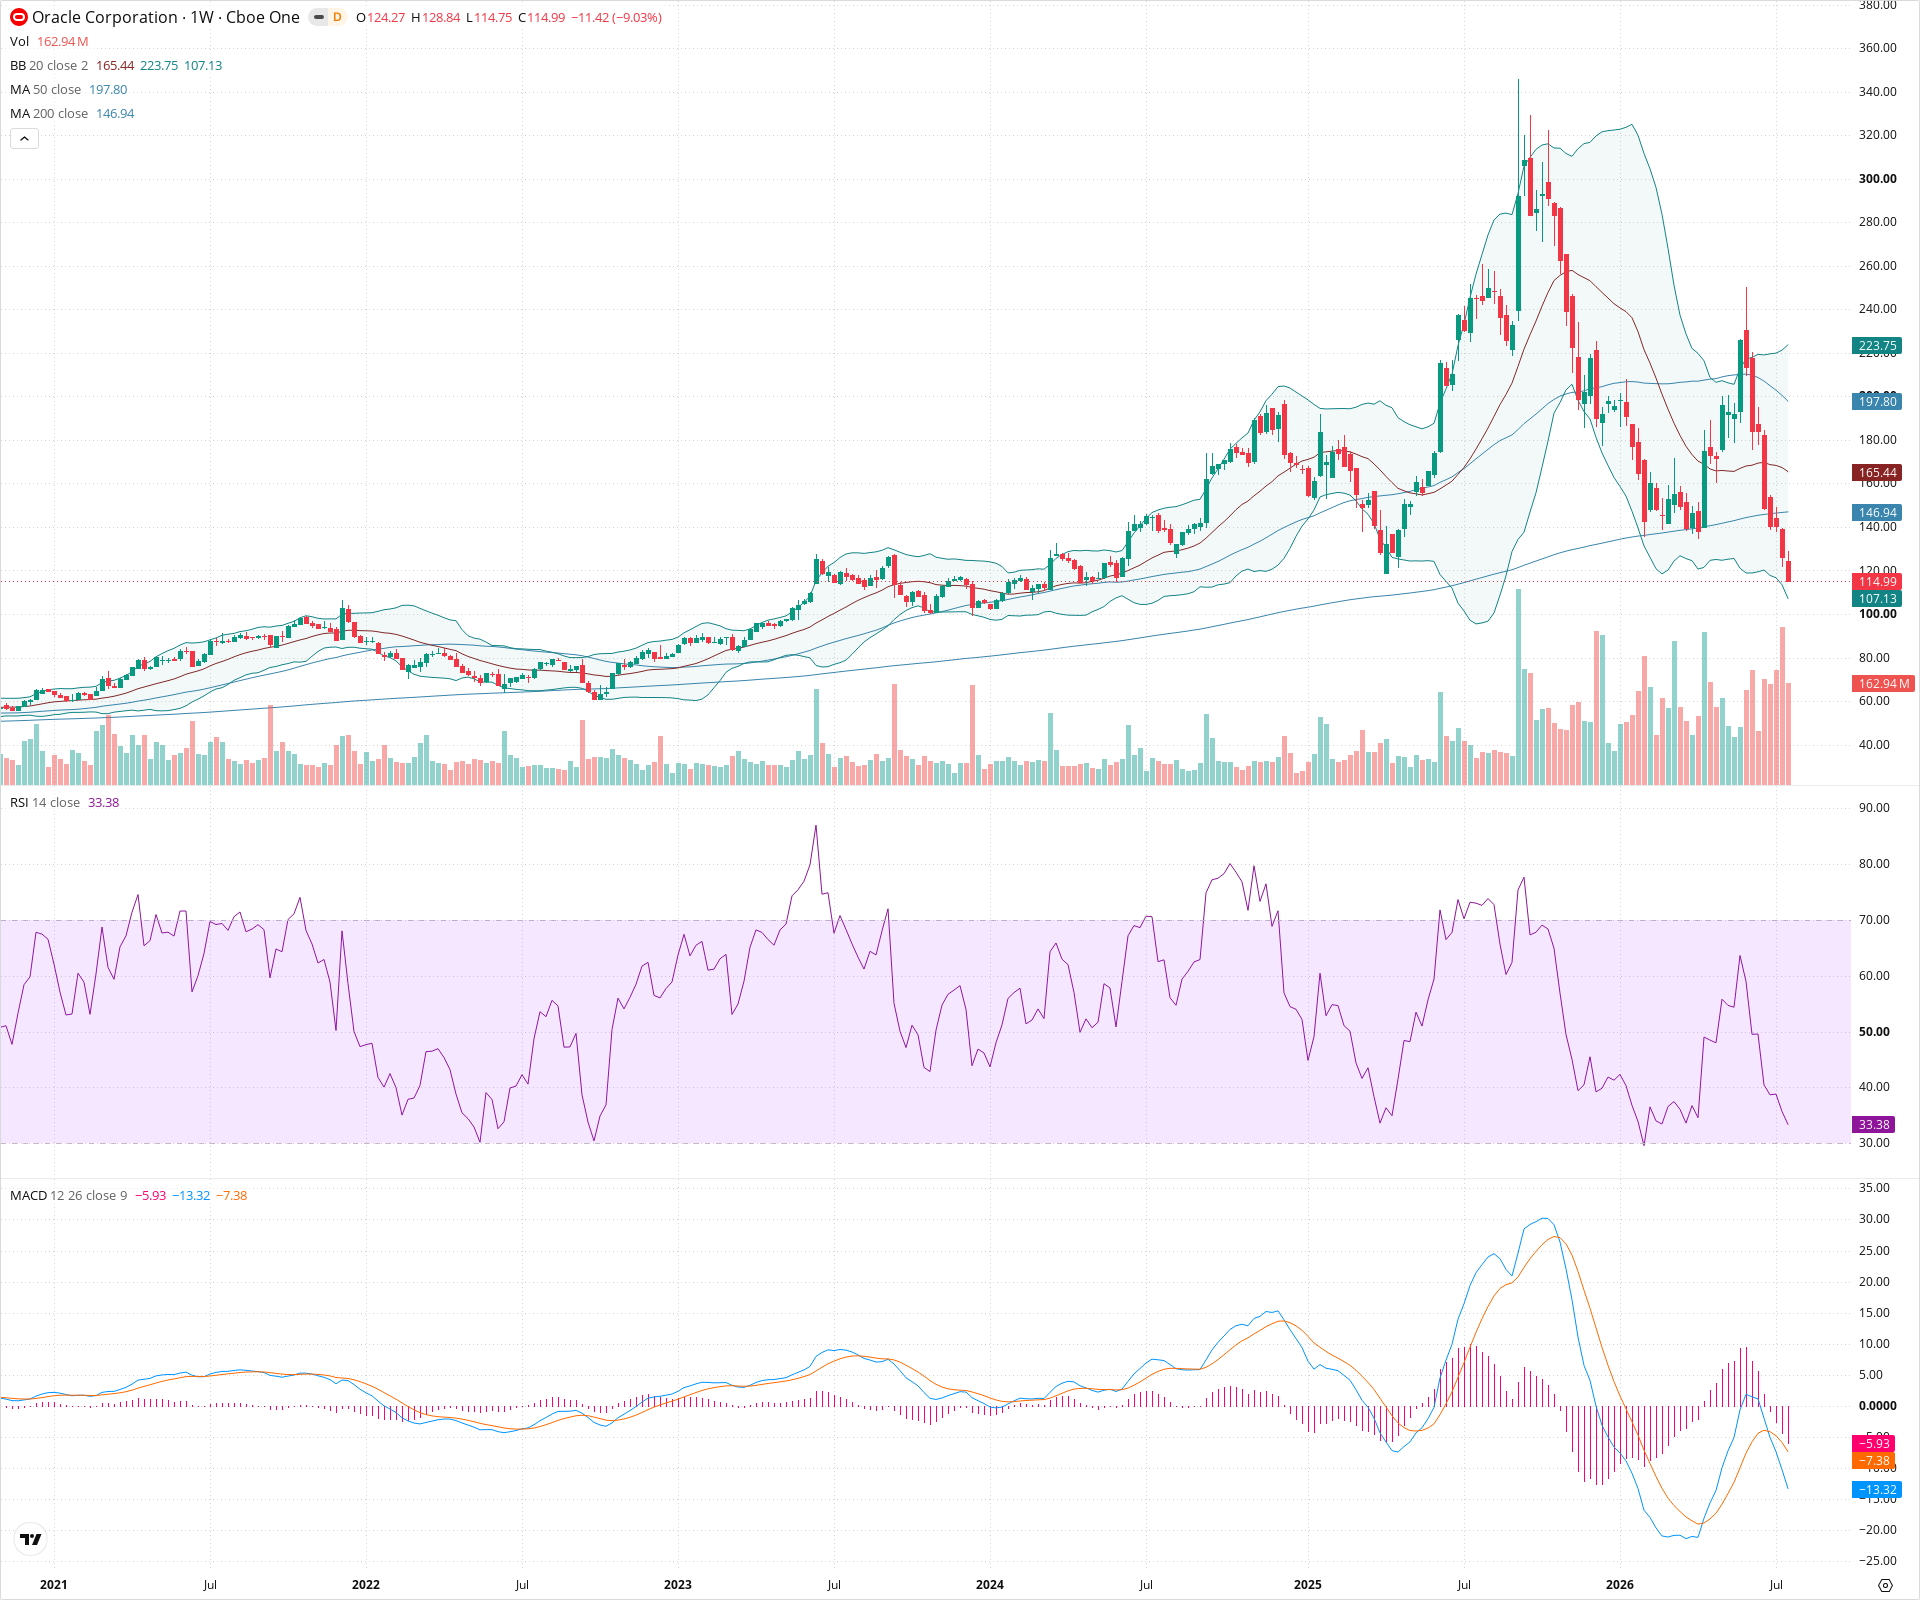
ORCL is currently undergoing a severe technical breakdown following a massive multi-year run. The price has violated key moving averages and completed a large topping pattern, entering a steep short-term downtrend with heavy bearish momentum on both RSI and MACD. However, for long-term investors, the stock is approaching a critical structural support zone near 105-110, which aligns with the rising 200-week SMA; how price reacts at this level will dictate the long-term trend.
Included In Lists
Related Tickers of Interest
ORCL Weekly Chart
Sentiment
Short-term Sentiment (days to weeks): Bearish
Price is in a sharp downtrend, losing the 50-week SMA, with RSI dropping near oversold levels and MACD accelerating lower.
Long-term Sentiment (weeks to months): Bullish
Despite the current sharp correction, the price remains above the rising 200-week SMA, and the broader multi-year trend is still intact.
Report Metadata
- Timeframe: weekly
- Generated at: 2026-07-25T09:04:25.898Z
- Model: gemini-3.1-pro-preview
Support Price Levels
| Level | Range | Strength | Notes |
|---|---|---|---|
| $107.50 | $105.00 - $110.00 | Strong | Prior consolidation zone and structural low before the major breakout, roughly coinciding with the 200-week SMA. |
| $85.00 | $80.00 - $90.00 | Strong | Base level from the extended sideways consolidation period prior to 2024. |
Resistance Price Levels
| Level | Range | Strength | Notes |
|---|---|---|---|
| $145.00 | $140.00 - $150.00 | Strong | Immediate overhead resistance, aligning with the declining 50-week SMA and previous swing low turned resistance. |
| $195.00 | $190.00 - $200.00 | Weak | Lower high established during the recent breakdown. |
| $340.00 | $330.00 - $350.00 | Strong | All-time high peak region. |
Potential Chart Patterns in Formation
| Strength | Pattern | Signal | Target | Details |
|---|---|---|---|---|
| Strong | Head and Shoulders (Top) | Bearish | N/A | A massive topping pattern with a peak near 340, a lower high near 230, and a sharp breakdown below the neckline (approx. 160). |
Frequently Asked Questions about ORCL
What is the current sentiment for ORCL?
The short-term sentiment for ORCL is currently Bearish because Price is in a sharp downtrend, losing the 50-week SMA, with RSI dropping near oversold levels and MACD accelerating lower.. The long-term trend is classified as Bullish.
What are the key support levels for ORCL?
StockDips.AI has identified key support levels for ORCL at $107.50 and $85.00. These levels may represent potential accumulation zones where buying interest could emerge.
Is ORCL in a significant dip or a Value Dip right now?
ORCL has a Value Score of 73/100. It is currently flagged as a significant dip in the Top Dips list. It is also listed as a Value Dip because long-term sentiment is bullish.
View the full interactive analysis on StockDips.AI.