SLNH Weekly Technical Analysis
Soluna Holdings, Inc
Soluna Holdings, Inc. develops and operates zero-carbon, green data centers powered by surplus renewable energy to support energy-intensive computing workloads, including AI, high-performance computing (HPC), and cryptocurrency mining.
SLNH Technical Analysis Summary
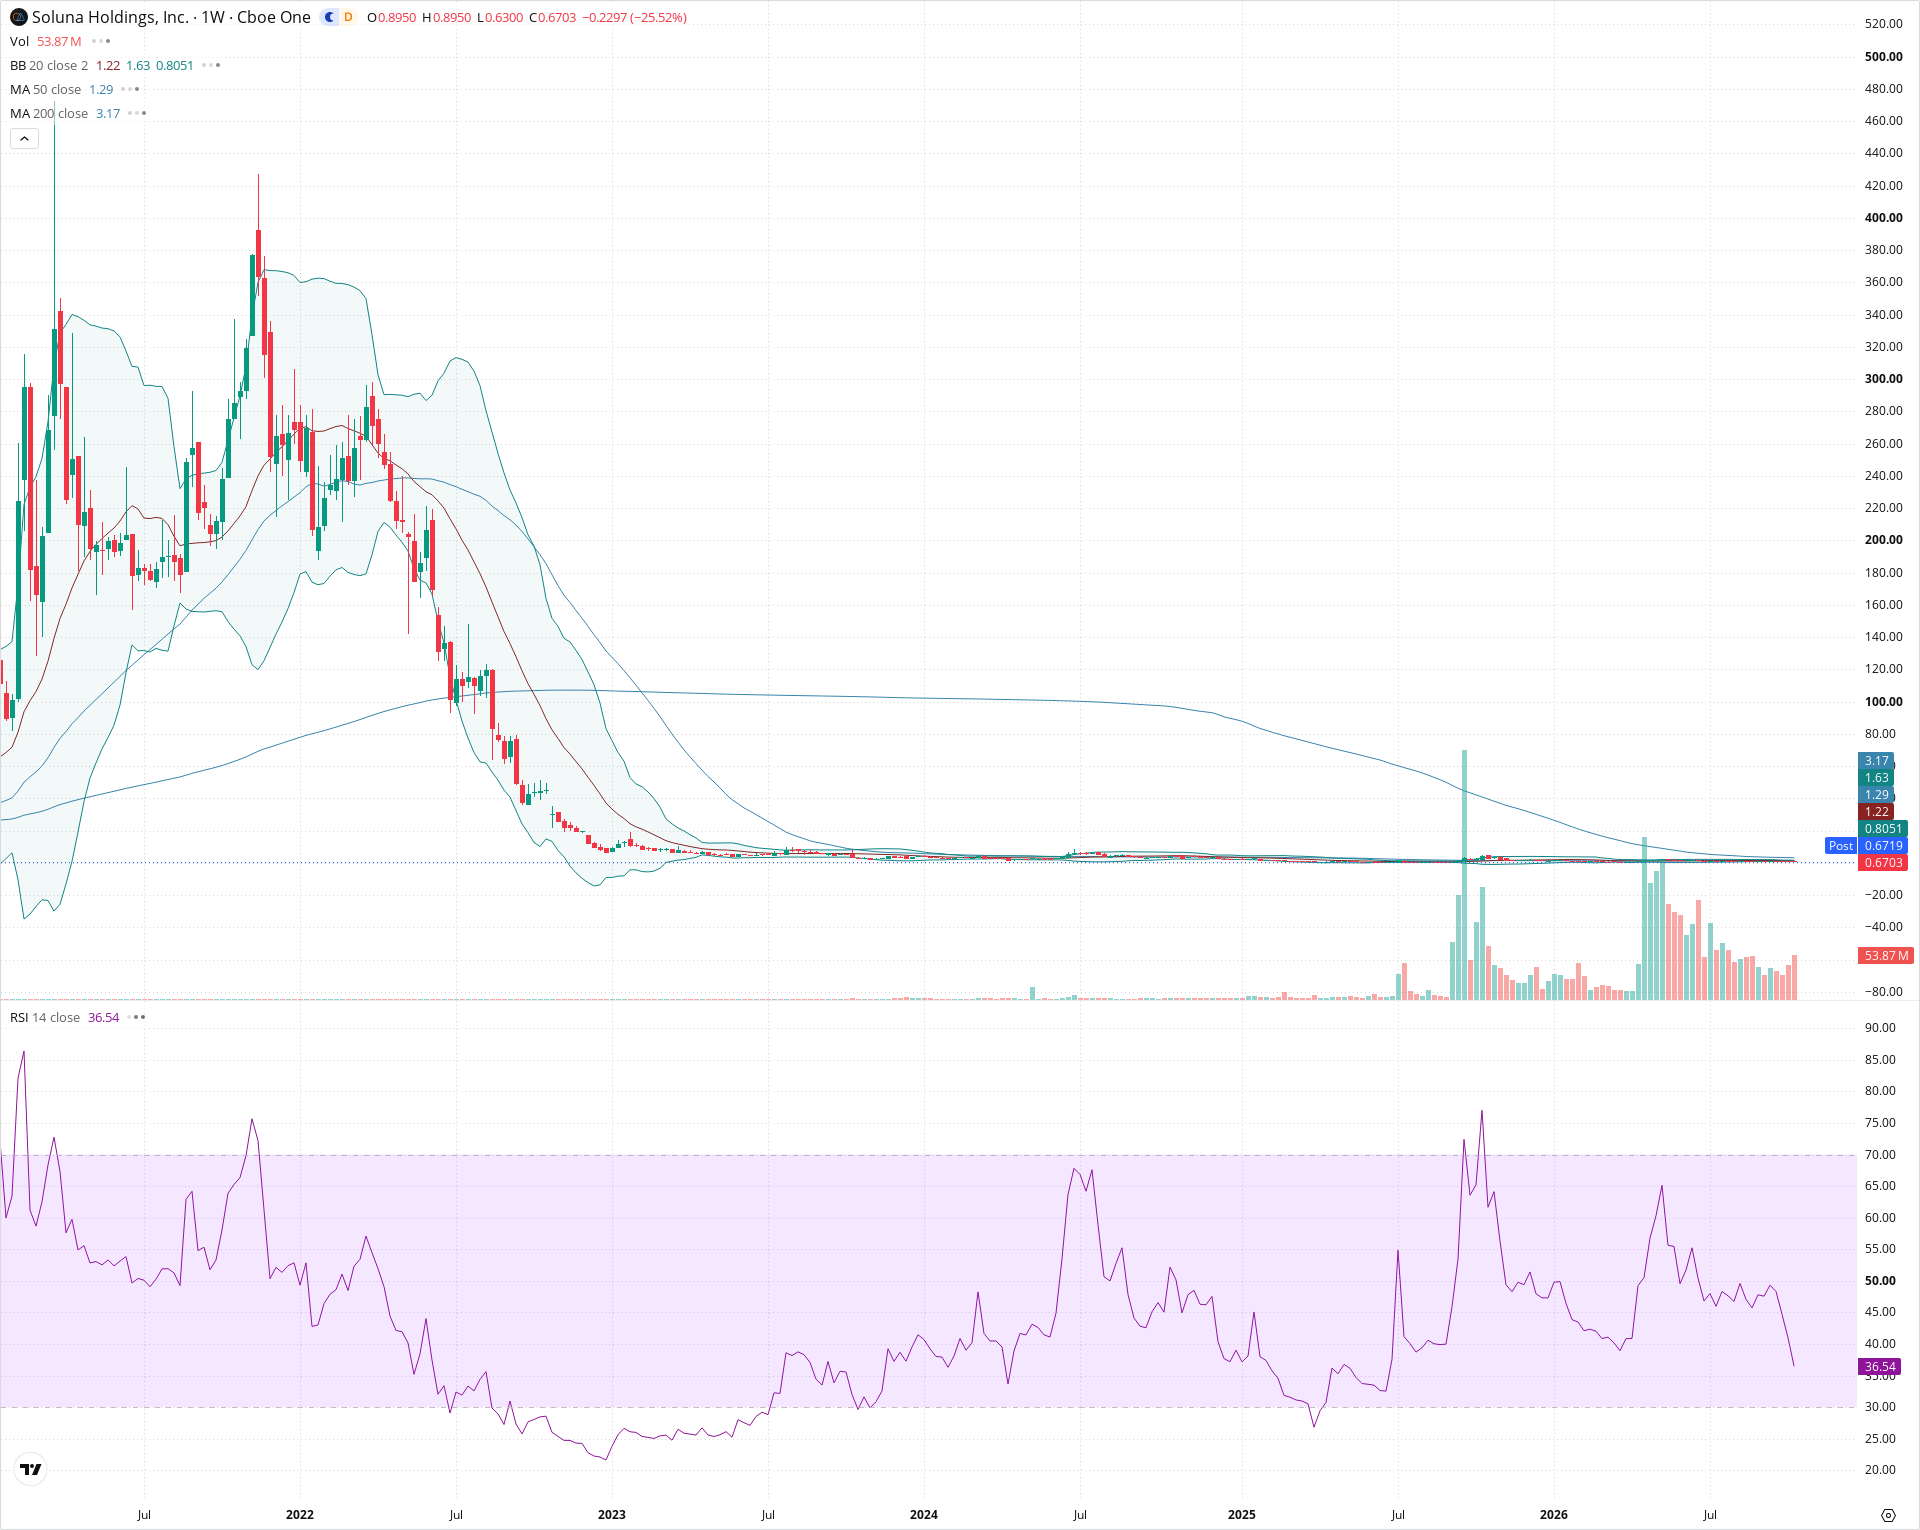
SLNH is currently locked in an aggressive weekly downtrend, trading at 0.6703 after breaking below both the 20-week and 50-week moving averages and the lower Bollinger Band. Heavy volume on the recent multi-week decline indicates sustained distribution, pushing RSI lower toward oversold territory. The overarching multi-year structural trend remains decidedly bearish below the 200-week SMA (3.17), with nearby support resting between 0.50 and 0.65.
Included In Lists
Related Tickers of Interest
SLNH Weekly Chart
Sentiment
Short-term Sentiment (days to weeks): Bearish
Price has broken sharply below the lower Bollinger Band on expanding sell volume, dropping well under the 20-week (1.22) and 50-week (1.29) moving averages as RSI accelerates downward to 36.54.
Long-term Sentiment (weeks to months): Bearish
The macro trend remains firmly downward following a massive multi-year decline, with price trading far beneath the descending 200-week SMA (3.17) and failing to establish a sustainable long-term base.
Report Metadata
- Timeframe: weekly
- Generated at: 2026-10-16T21:11:24.473Z
- Model: gemini-3.8-flash
Support Price Levels
| Level | Range | Strength | Notes |
|---|---|---|---|
| $0.58 | $0.50 - $0.65 | Moderate | Historical base lows established during the extended 2023–2024 bottoming range. |
| $0.33 | $0.25 - $0.40 | Weak | Lower historical tail support if the current floor fails to hold. |
Resistance Price Levels
| Level | Range | Strength | Notes |
|---|---|---|---|
| $1.05 | $0.80 - $1.30 | Moderate | Confluence of the lower Bollinger Band, 20-week SMA (1.22), and 50-week SMA (1.29) acting as overhead supply. |
| $3.25 | $3.00 - $3.50 | Strong | Major structural resistance defined by the declining 200-week moving average (3.17) and prior spike highs. |
Potential Chart Patterns in Formation
| Strength | Pattern | Signal | Target | Details |
|---|---|---|---|---|
| Moderate | Horizontal Range Breakdown | Bearish | $0.50 | After consolidating along moving averages throughout 2024–2025, price has breached multi-month shelf support to the downside on elevated volume. |
Frequently Asked Questions about SLNH
What is the current sentiment for SLNH?
The short-term sentiment for SLNH is currently Bearish because Price has broken sharply below the lower Bollinger Band on expanding sell volume, dropping well under the 20-week (1.22) and 50-week (1.29) moving averages as RSI accelerates downward to 36.54.. The long-term trend is classified as Bearish.
What are the key support levels for SLNH?
StockDips.AI has identified key support levels for SLNH at $0.58 and $0.33. These levels may represent potential accumulation zones where buying interest could emerge.
Is SLNH in a significant dip or a Value Dip right now?
SLNH has a Value Score of 97/100. It is currently flagged as a significant dip in the Top Dips list. It is not listed as a Value Dip because the long-term sentiment or value-score threshold does not qualify.
View the full interactive analysis on StockDips.AI.