SNOW Daily Technical Analysis
Snowflake Inc
Cloud data platform for storing and analyzing data across providers.
SNOW Technical Analysis Summary
SNOW exhibits a robust long-term bullish trend after successfully breaking out of a prolonged basing structure, supported by favorable moving average alignments. In the near term, the stock is undergoing a healthy period of consolidation, allowing momentum indicators like MACD and RSI to reset before a potential continuation higher. Investors should monitor the 240-245 zone as a key area for support during pullbacks.
Included In Lists
Related Tickers of Interest
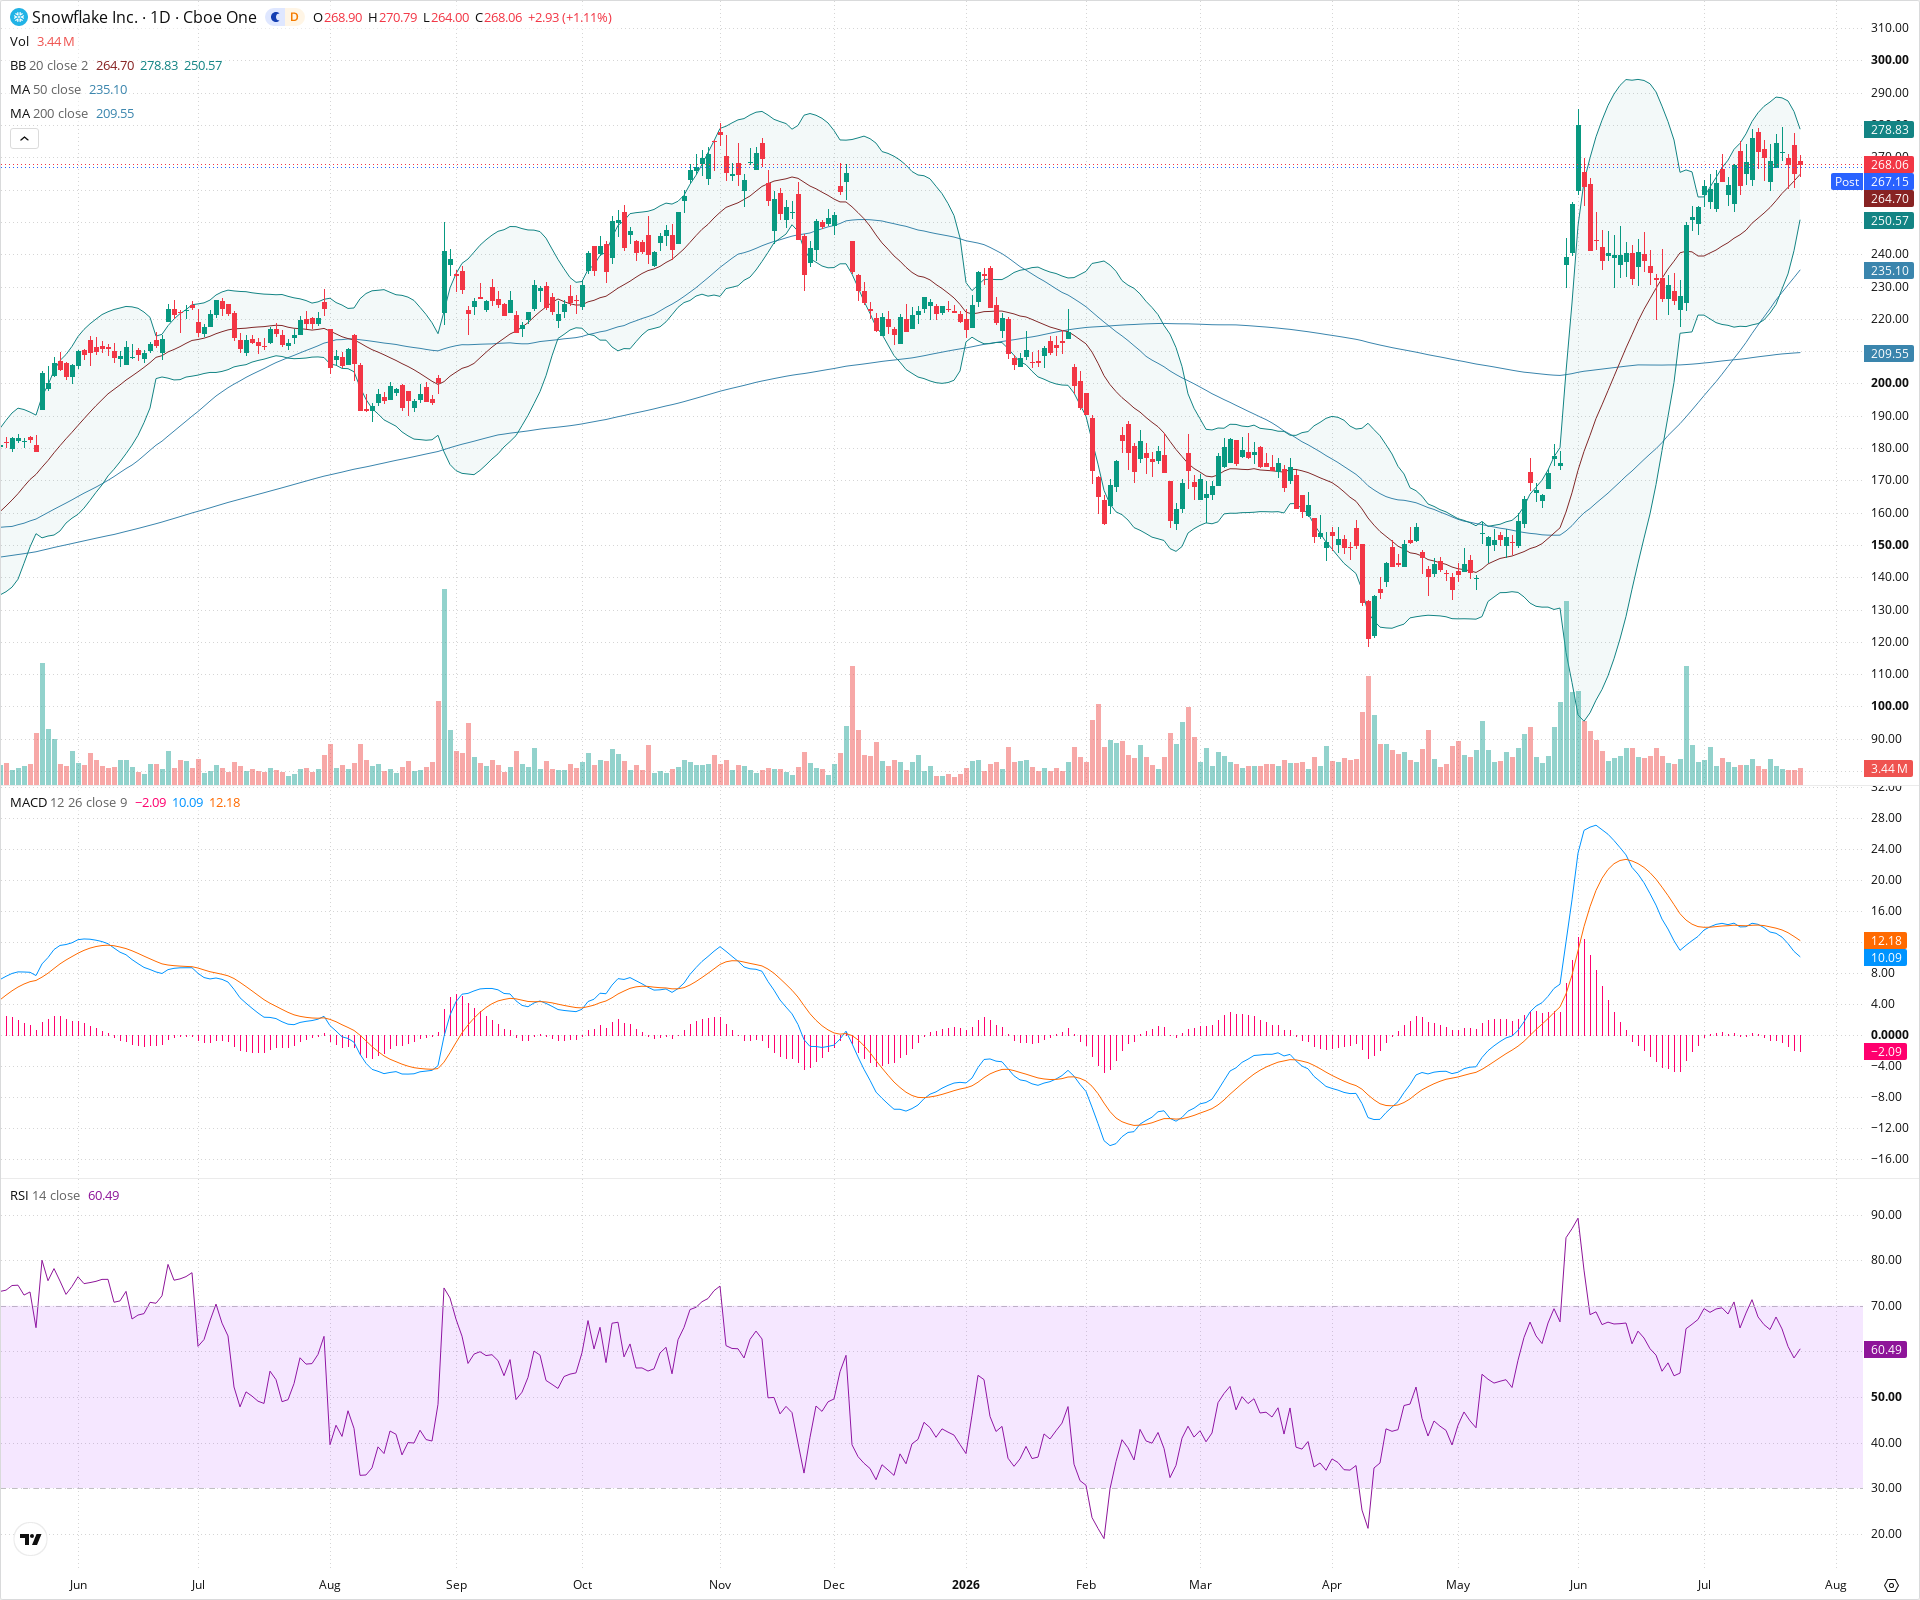
SNOW Daily Chart
Sentiment
Short-term Sentiment (days to weeks): Neutral
Price is consolidating near recent highs, with the MACD histogram turning negative and RSI cooling down from overbought levels, suggesting fading short-term momentum.
Long-term Sentiment (weeks to months): Bullish
Price is trading well above upward-sloping 50-day and 200-day SMAs, following a significant breakout from a multi-month basing structure.
Report Metadata
- Timeframe: daily
- Generated at: 2026-07-24T21:10:21.099Z
- Model: gemini-3.1-pro-preview
Support Price Levels
| Level | Range | Strength | Notes |
|---|---|---|---|
| $242.50 | $240.00 - $245.00 | Strong | Previous major resistance level from the multi-month base, now expected to act as polarity support. |
| $233.00 | $230.00 - $236.00 | Strong | Confluence of the rising 50-day SMA and recent consolidation area prior to the latest leg up. |
| $207.50 | $205.00 - $210.00 | Strong | Rising 200-day SMA and historical support zone. |
Resistance Price Levels
| Level | Range | Strength | Notes |
|---|---|---|---|
| $277.50 | $275.00 - $280.00 | Strong | Recent swing high and the vicinity of the upper Bollinger Band. |
| $300.00 | $295.00 - $305.00 | Weak | Previous historical resistance visible on the far left of the chart and the psychological 300 level. |
Potential Chart Patterns in Formation
| Strength | Pattern | Signal | Target | Details |
|---|---|---|---|---|
| Strong | Rounding Bottom Breakout | Bullish | N/A | A massive multi-month rounding bottom or 'cup' pattern that broke out above the ~240 resistance level with significant momentum. |
Frequently Asked Questions about SNOW
What is the current sentiment for SNOW?
The short-term sentiment for SNOW is currently Neutral because Price is consolidating near recent highs, with the MACD histogram turning negative and RSI cooling down from overbought levels, suggesting fading short-term momentum.. The long-term trend is classified as Bullish.
What are the key support levels for SNOW?
StockDips.AI has identified key support levels for SNOW at $242.50 and $233.00. These levels may represent potential accumulation zones where buying interest could emerge.
Is SNOW in a significant dip or a Value Dip right now?
SNOW has a Value Score of 27/100. It is not currently flagged as a significant dip in the Top Dips list. It is not listed as a Value Dip because the long-term sentiment or value-score threshold does not qualify.
View the full interactive analysis on StockDips.AI.