SNOW Weekly Technical Analysis
Snowflake Inc
Cloud data platform for storing and analyzing data across providers.
SNOW Technical Analysis Summary
SNOW exhibits a strong bullish technical structure on the weekly timeframe, having recently broken out of a multi-year consolidation base. Momentum is firmly to the upside as evidenced by the sharp break above key moving averages, supported by rising MACD and RSI. While short-term overbought conditions may lead to pullbacks or consolidation, the long-term trend appears to have reversed to the upside, with the next major test arriving at the 280-300 resistance zone.
Included In Lists
Related Tickers of Interest
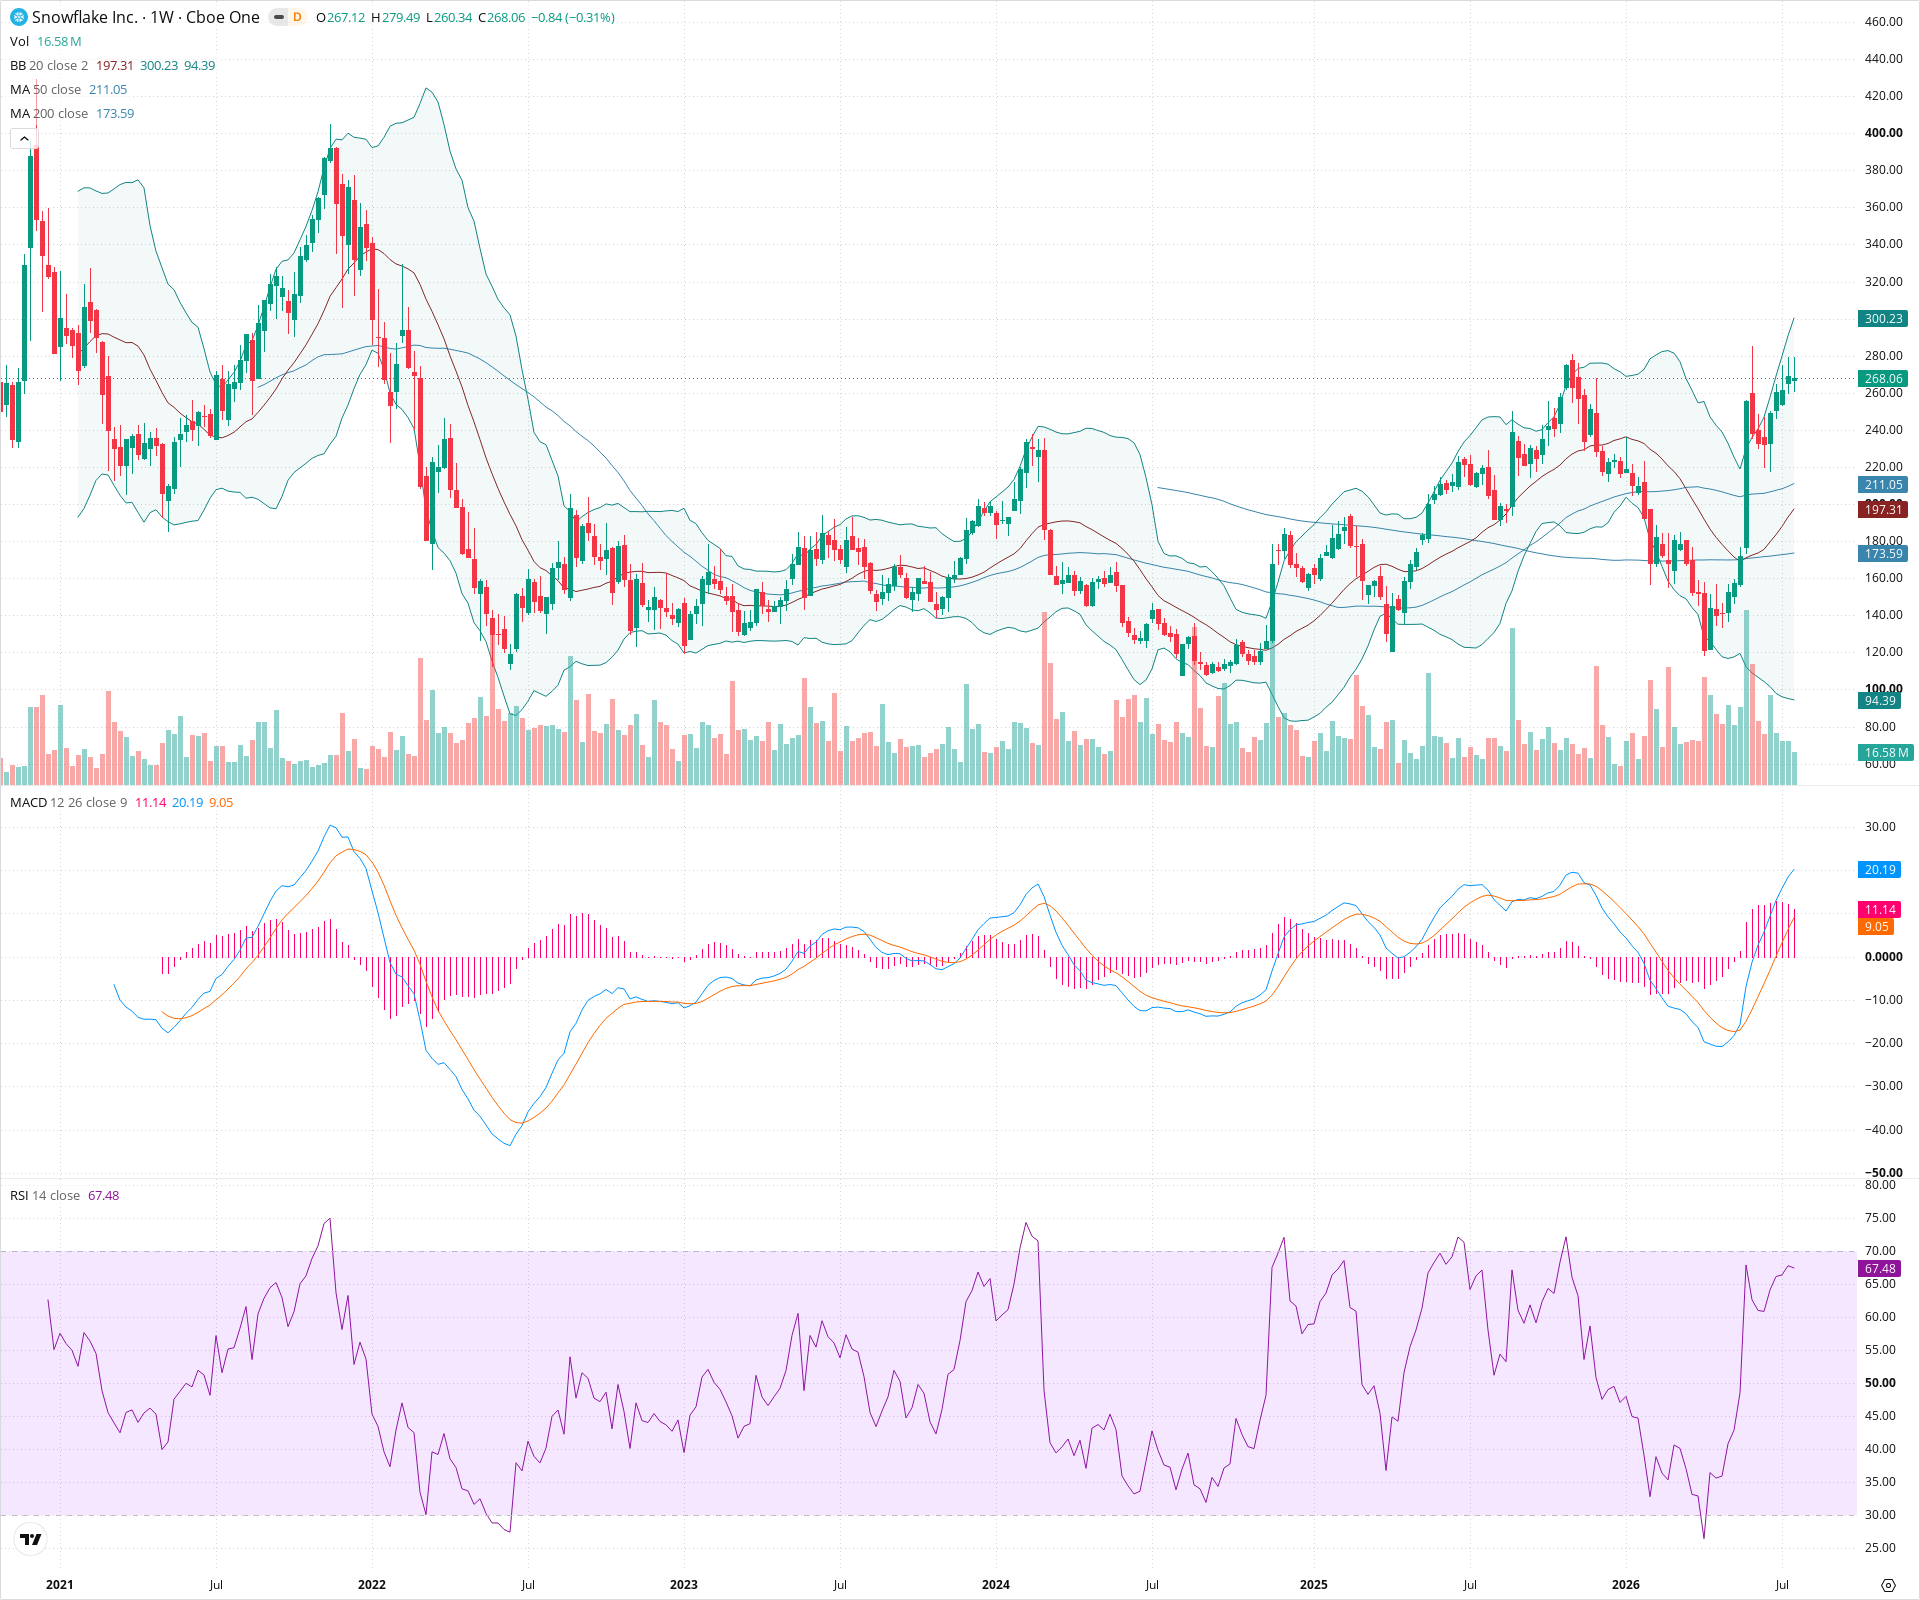
SNOW Weekly Chart
Sentiment
Short-term Sentiment (days to weeks): Bullish
Price is in a sharp uptrend over recent weeks, currently testing resistance near the upper Bollinger Band. RSI is in the bullish zone (around 67) and MACD is rising with expanding positive histogram, confirming short-term momentum.
Long-term Sentiment (weeks to months): Bullish
Price has firmly broken above all major moving averages (20, 50, 200 SMA). The 20 SMA has crossed above the 200 SMA, and the price is approaching a major prior resistance zone around 280-300, indicating a long-term trend reversal from the multi-year consolidation.
Report Metadata
- Timeframe: weekly
- Generated at: 2026-07-25T09:06:18.214Z
- Model: gemini-3.1-pro-preview
Support Price Levels
| Level | Range | Strength | Notes |
|---|---|---|---|
| $215.00 | $210.00 - $220.00 | Strong | Prior resistance zone that was broken and may act as support on a pullback. Confluent with the rising 50-week SMA. |
| $175.00 | $170.00 - $180.00 | Strong | Major structural low and consolidation area throughout much of the previous year; roughly aligns with the 200-week SMA. |
Resistance Price Levels
| Level | Range | Strength | Notes |
|---|---|---|---|
| $290.00 | $280.00 - $300.00 | Strong | Major prior structural high and psychological level from before the significant downtrend. |
| $330.00 | $320.00 - $340.00 | Weak | Historical resistance area on the way down from all-time highs. |
Potential Chart Patterns in Formation
| Strength | Pattern | Signal | Target | Details |
|---|---|---|---|---|
| Strong | Rounding Bottom / U-Shape Recovery | Bullish | N/A | Multi-year basing pattern forming a broad 'U' shape, indicating accumulation and a potential long-term trend change. |
| Strong | Moving Average Breakout | Bullish | N/A | Price recently surged strongly through the 200-week SMA on expanding volume. |
Frequently Asked Questions about SNOW
What is the current sentiment for SNOW?
The short-term sentiment for SNOW is currently Bullish because Price is in a sharp uptrend over recent weeks, currently testing resistance near the upper Bollinger Band. RSI is in the bullish zone (around 67) and MACD is rising with expanding positive histogram, confirming short-term momentum.. The long-term trend is classified as Bullish.
What are the key support levels for SNOW?
StockDips.AI has identified key support levels for SNOW at $215.00 and $175.00. These levels may represent potential accumulation zones where buying interest could emerge.
Is SNOW in a significant dip or a Value Dip right now?
SNOW has a Value Score of 27/100. It is not currently flagged as a significant dip in the Top Dips list. It is not listed as a Value Dip because the long-term sentiment or value-score threshold does not qualify.
View the full interactive analysis on StockDips.AI.