STM Weekly Technical Analysis
STMicroelectronics NV
STMicroelectronics N.V. is a global semiconductor leader designing, developing, manufacturing, and marketing a broad range of discrete devices, microcontrollers, power management chips, and custom integrated circuits for automotive, industrial, consumer, and communications applications.
STM Technical Analysis Summary
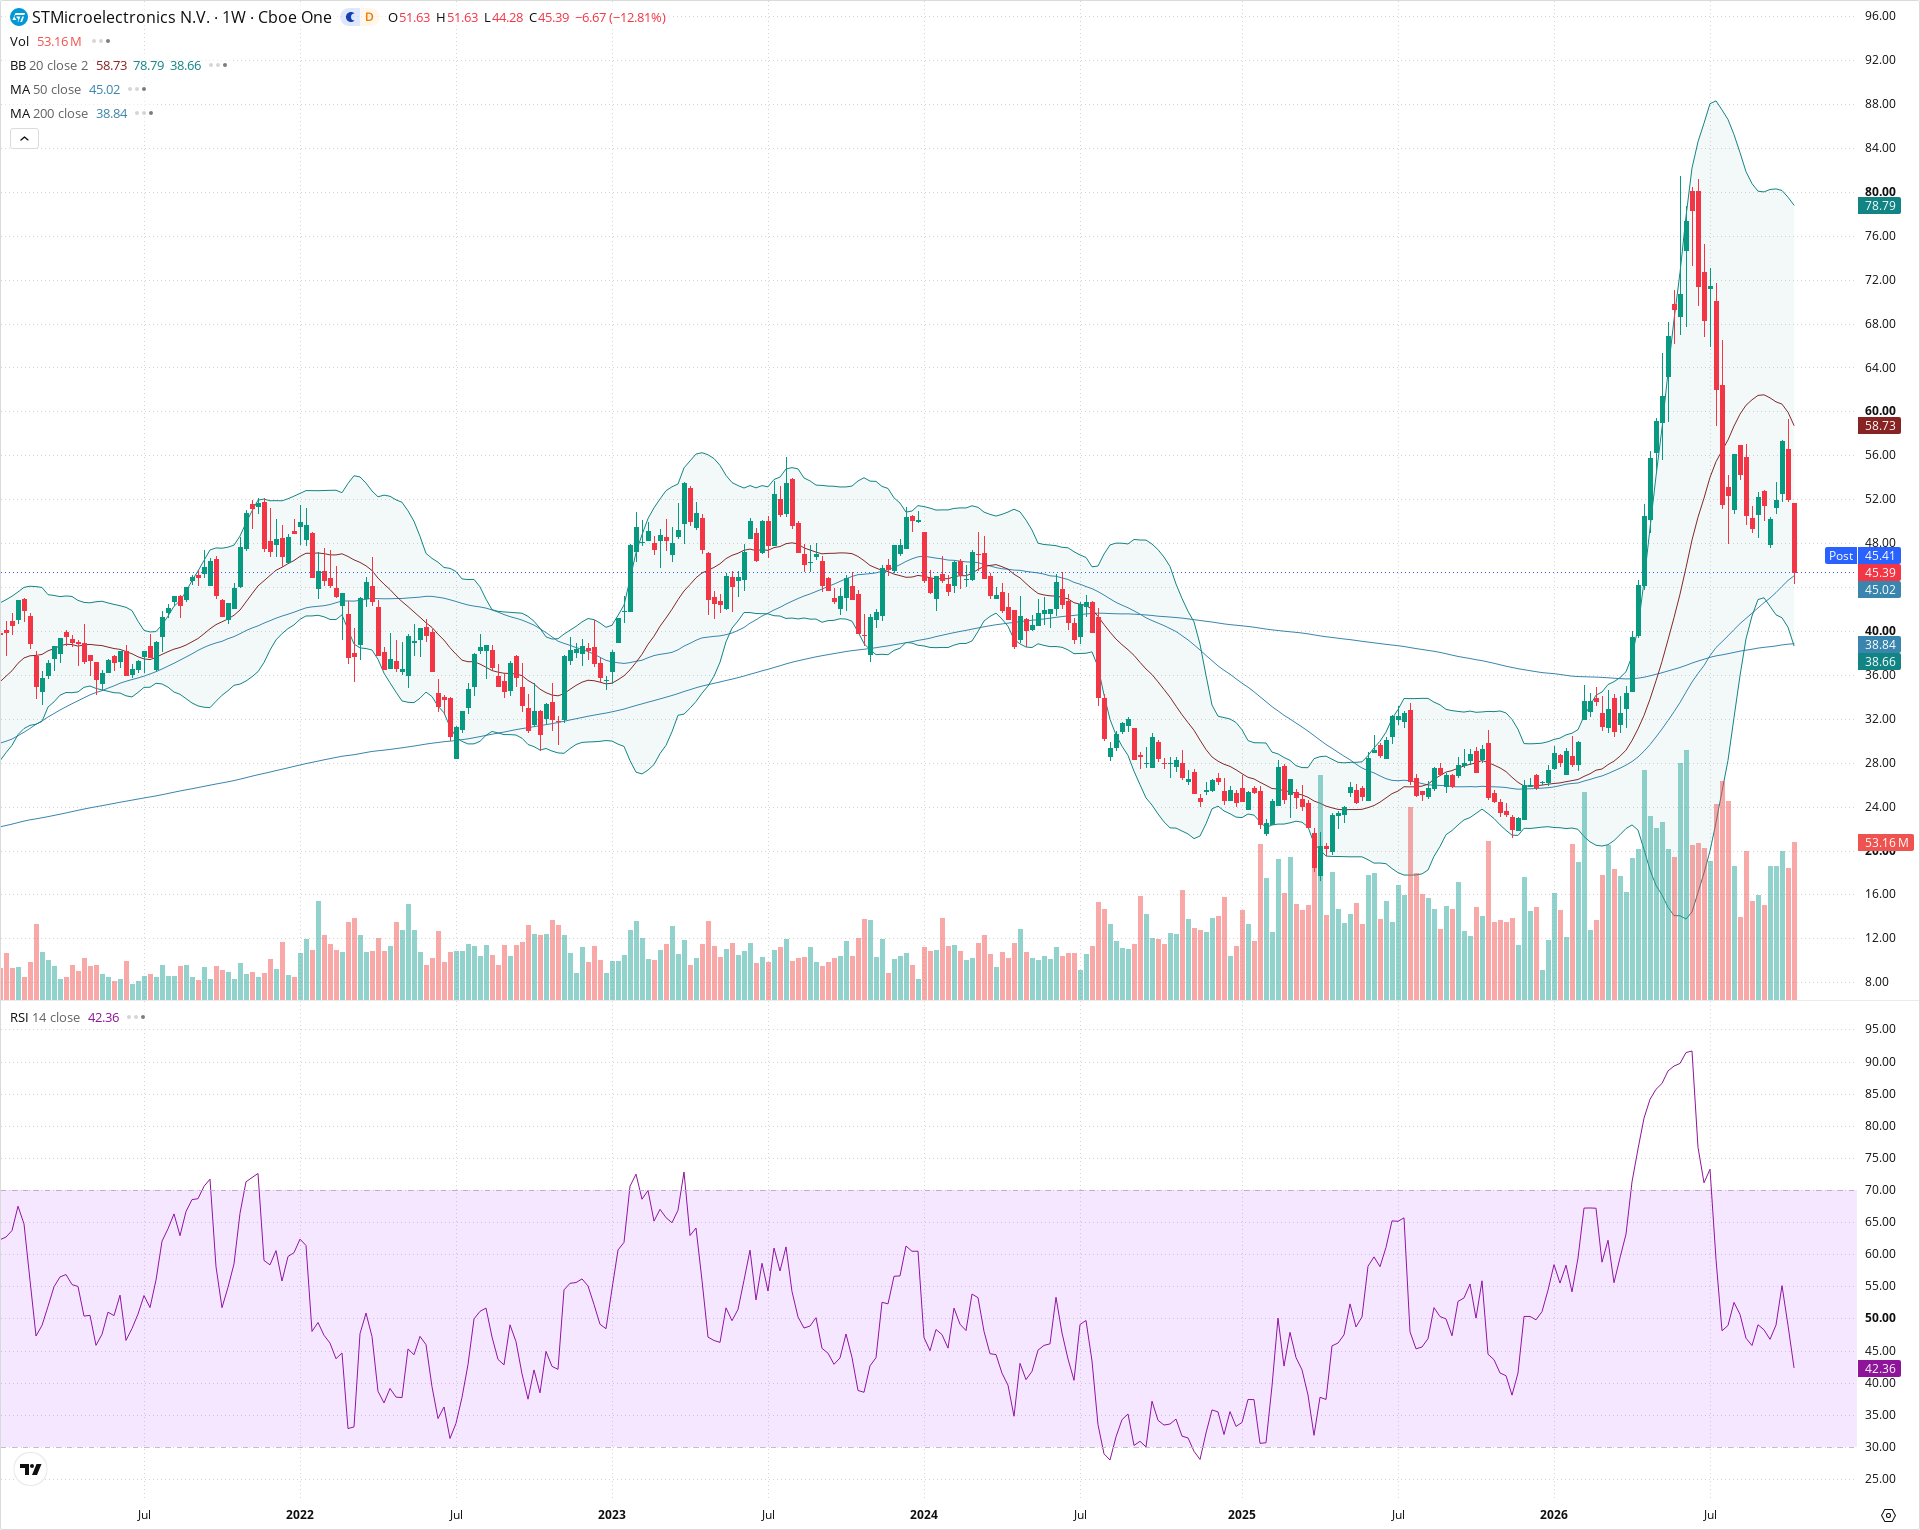
STM is undergoing a severe multi-week correction after a parabolic surge toward 80.00, dropping sharply back toward its rising 50-week moving average around 45.00. While short-term momentum is firmly bearish due to heavy distribution volume and RSI deteriorating below 50, the broader macro structure retains a bullish foundation as long as price holds above the 50-week and 200-week SMA confluence zone between 38.50 and 45.00. Investors should monitor whether buyers step in near current support or if a deeper mean reversion toward 39.00 unfolds.
Included In Lists
Related Tickers of Interest
STM Weekly Chart
Sentiment
Short-term Sentiment (days to weeks): Bearish
Aggressive multi-week selloff from the ~80.00 highs, breaking well below the 20-week SMA with expanding downside volume and RSI dropping to 42.36.
Long-term Sentiment (weeks to months): Bullish
The 50-week SMA (45.02) remains positioned above the 200-week SMA (38.84), maintaining a higher-timeframe bullish moving average structure despite the deep corrective pullback.
Report Metadata
- Timeframe: weekly
- Generated at: 2026-10-16T21:07:24.273Z
- Model: gemini-3.8-flash
Support Price Levels
| Level | Range | Strength | Notes |
|---|---|---|---|
| $44.50 | $43.50 - $45.50 | Moderate | Current price zone aligned with the rising 50-week SMA and former multi-week consolidation resistance from 2023. |
| $39.00 | $38.00 - $40.00 | Strong | Major structural support zone defined by the 200-week SMA (38.84) and the lower Bollinger Band. |
Resistance Price Levels
| Level | Range | Strength | Notes |
|---|---|---|---|
| $56.88 | $55.00 - $58.75 | Strong | Confluence of the 20-week SMA and the lower boundary of the previous distribution range. |
| $78.00 | $76.00 - $80.00 | Strong | Major cyclical peak where heavy distribution reversed the parabolic advance. |
Potential Chart Patterns in Formation
| Strength | Pattern | Signal | Target | Details |
|---|---|---|---|---|
| Strong | Mean Reversion / Corrective Channel | Bearish | $38.84 | Steep multi-week liquidation following an overextended parabolic climb, reverting price directly back to test the 50-week SMA. |
Frequently Asked Questions about STM
What is the current sentiment for STM?
The short-term sentiment for STM is currently Bearish because Aggressive multi-week selloff from the ~80.00 highs, breaking well below the 20-week SMA with expanding downside volume and RSI dropping to 42.36.. The long-term trend is classified as Bullish.
What are the key support levels for STM?
StockDips.AI has identified key support levels for STM at $44.50 and $39.00. These levels may represent potential accumulation zones where buying interest could emerge.
Is STM in a significant dip or a Value Dip right now?
STM has a Value Score of 80/100. It is currently flagged as a significant dip in the Top Dips list. It is also listed as a Value Dip because long-term sentiment is bullish.
View the full interactive analysis on StockDips.AI.