TXRH Weekly Technical Analysis
Texas Roadhouse Inc
Chain of family steakhouses known for hand-cut steaks and casual dining.
TXRH Technical Analysis Summary
TXRH remains in a robust long-term uptrend, characterized by a consistent pattern of higher highs and higher lows. While short-term momentum indicators like MACD suggest a potential slowing of the recent advance, the overall structure and moving average alignment strongly favor the bulls. Significant support levels are well-defined below current prices, providing a favorable risk/reward profile for long-term investors.
Included In Lists
Related Tickers of Interest
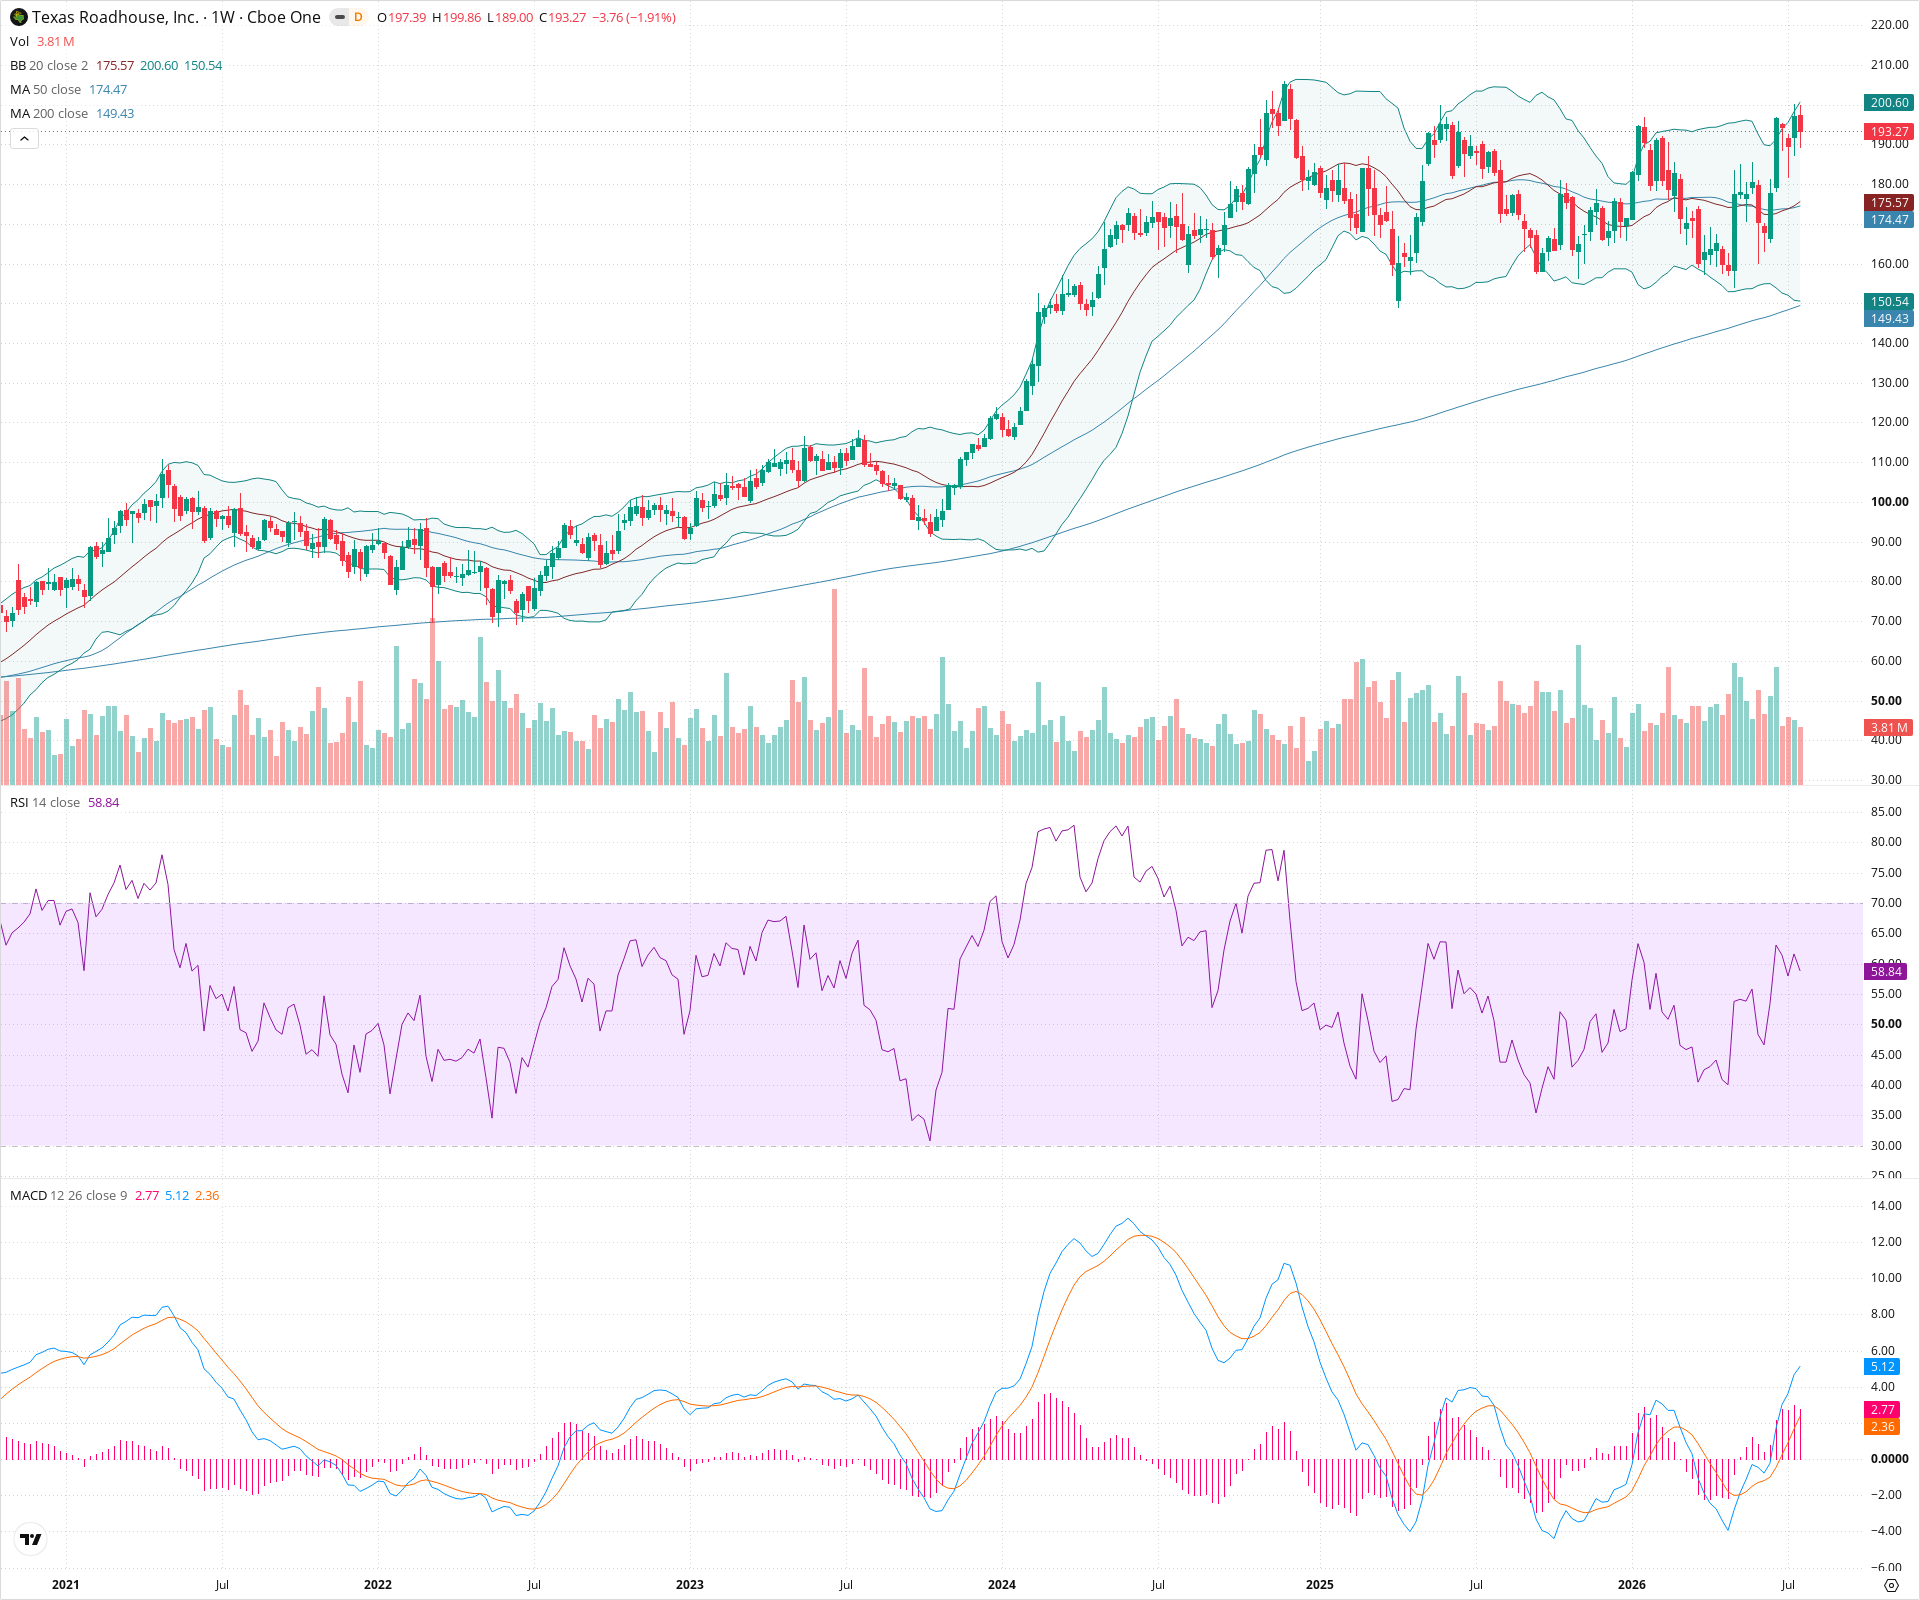
TXRH Weekly Chart
Sentiment
Short-term Sentiment (days to weeks): Neutral
Price is testing the recent high, but the MACD histogram is decreasing and RSI is slightly elevated, indicating a potential near-term consolidation or minor pullback before further upward movement.
Long-term Sentiment (weeks to months): Bullish
The long-term trend is clearly up, with price consistently making higher highs and higher lows. The 50-week SMA is trending strongly upwards and remains well above the 200-week SMA.
Report Metadata
- Timeframe: weekly
- Generated at: 2026-07-25T09:07:09.400Z
- Model: gemini-3.1-pro-preview
Support Price Levels
| Level | Range | Strength | Notes |
|---|---|---|---|
| $172.50 | $170.00 - $175.00 | Strong | Significant prior support/resistance zone, coinciding roughly with the current position of the 50-week SMA. |
| $147.50 | $145.00 - $150.00 | Strong | Major prior consolidation zone and swing low area, reinforced by the upward-sloping 200-week SMA. |
Resistance Price Levels
| Level | Range | Strength | Notes |
|---|---|---|---|
| $197.50 | $195.00 - $200.00 | Weak | Current all-time high area; minor psychological resistance. |
Potential Chart Patterns in Formation
| Strength | Pattern | Signal | Target | Details |
|---|---|---|---|---|
| Strong | Uptrend Channel | Bullish | N/A | Price is trading within a broad, upward-sloping channel over a multi-year period, consistently respecting moving average support during pullbacks. |
Frequently Asked Questions about TXRH
What is the current sentiment for TXRH?
The short-term sentiment for TXRH is currently Neutral because Price is testing the recent high, but the MACD histogram is decreasing and RSI is slightly elevated, indicating a potential near-term consolidation or minor pullback before further upward movement.. The long-term trend is classified as Bullish.
What are the key support levels for TXRH?
StockDips.AI has identified key support levels for TXRH at $172.50 and $147.50. These levels may represent potential accumulation zones where buying interest could emerge.
Is TXRH in a significant dip or a Value Dip right now?
TXRH has a Value Score of 30/100. It is not currently flagged as a significant dip in the Top Dips list. It is not listed as a Value Dip because the long-term sentiment or value-score threshold does not qualify.
View the full interactive analysis on StockDips.AI.