UBER Daily Technical Analysis
Uber Technologies Inc
Platform for ride-hailing, food delivery via Uber Eats, and freight services.
UBER Technical Analysis Summary
UBER is currently exhibiting strong bearish technical signals on both short and long-term timeframes. A recent 'death cross' of the major moving averages confirms a broader trend reversal, while a sharp recent breakdown below the lower Bollinger Band suggests accelerating downside momentum. The stock is currently testing a weak historical support zone, with significant overhead resistance formed by the declining moving averages.
Included In Lists
Related Tickers of Interest
UBER Daily Chart
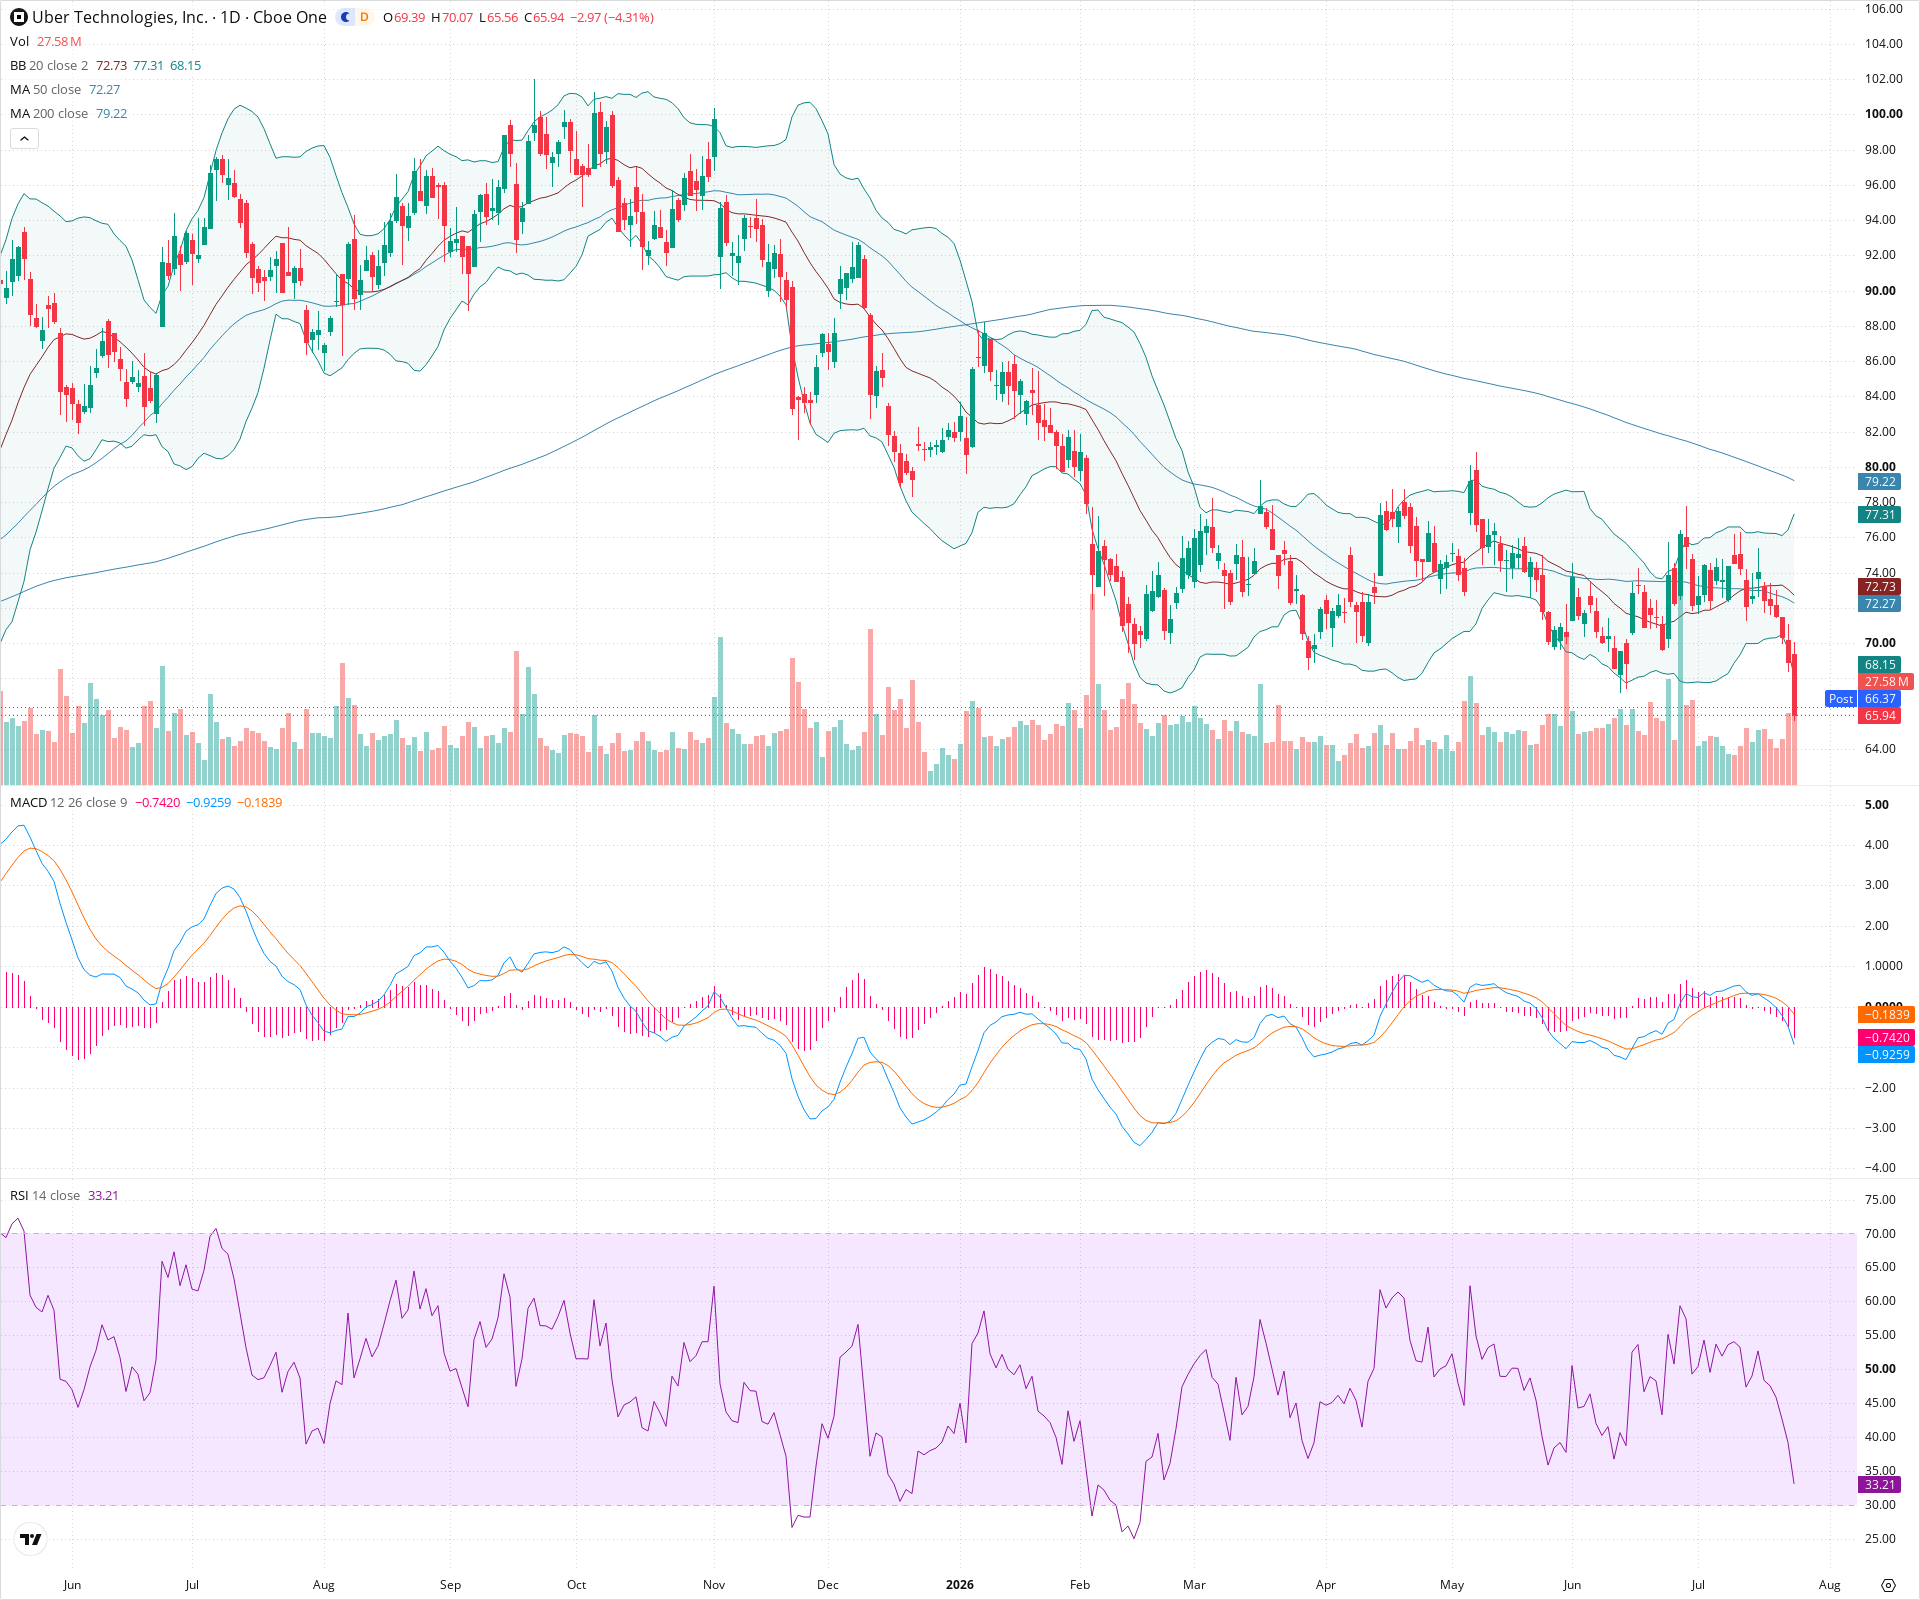
Sentiment
Short-term Sentiment (days to weeks): Bearish
Price has experienced a sharp, high-volume breakdown, closing below the lower Bollinger Band. MACD histogram is expanding negatively, and RSI is pointing down, nearing oversold territory.
Long-term Sentiment (weeks to months): Bearish
The stock has formed a series of lower highs and lower lows over several months. A recent 'death cross' (50 SMA crossing below 200 SMA) confirms a shift to a longer-term downtrend.
Report Metadata
- Timeframe: daily
- Generated at: 2026-07-24T21:17:25.600Z
- Model: gemini-3.1-pro-preview
Support Price Levels
| Level | Range | Strength | Notes |
|---|---|---|---|
| $65.00 | $64.00 - $66.00 | Weak | Immediate support area based on historical price action at the far left of the chart. The current price is testing this zone. |
| $58.00 | $56.00 - $60.00 | Strong | Major historical consolidation zone visible early in the charted period. |
Resistance Price Levels
| Level | Range | Strength | Notes |
|---|---|---|---|
| $73.00 | $72.00 - $74.00 | Strong | Former support level that recently broke down, now aligns with the declining 20-day SMA. |
| $78.50 | $77.00 - $80.00 | Strong | Significant resistance zone containing the 50-day and 200-day SMAs. |
Potential Chart Patterns in Formation
| Strength | Pattern | Signal | Target | Details |
|---|---|---|---|---|
| Strong | Death Cross | Bearish | N/A | The 50-day SMA has crossed below the 200-day SMA, indicating a potential long-term bearish trend shift. |
| Strong | Downtrend / Lower Highs | Bearish | N/A | Price action since the peak shows a clear sequence of lower highs and lower lows. |
Frequently Asked Questions about UBER
What is the current sentiment for UBER?
The short-term sentiment for UBER is currently Bearish because Price has experienced a sharp, high-volume breakdown, closing below the lower Bollinger Band. MACD histogram is expanding negatively, and RSI is pointing down, nearing oversold territory.. The long-term trend is classified as Bearish.
What are the key support levels for UBER?
StockDips.AI has identified key support levels for UBER at $65.00 and $58.00. These levels may represent potential accumulation zones where buying interest could emerge.
Is UBER in a significant dip or a Value Dip right now?
UBER has a Value Score of 88/100. It is currently flagged as a significant dip in the Top Dips list. It is not listed as a Value Dip because the long-term sentiment or value-score threshold does not qualify.
View the full interactive analysis on StockDips.AI.