MRVL Daily Technical Analysis
Marvell Technology Inc
Designs semiconductors for networking, storage, and 5G infrastructure.
MRVL Technical Analysis Summary
MRVL experienced a massive parabolic run earlier in the year but is currently undergoing a severe and rapid short-term correction, behaving like a falling knife. Despite this violent pullback, the long-term trend remains technically bullish as long as the price stays well above the rising 200-day SMA. Long-term investors should watch for signs of momentum exhaustion and base building near the 160-180 support zone or the 200-day moving average before considering new entries.
Included In Lists
Related Tickers of Interest
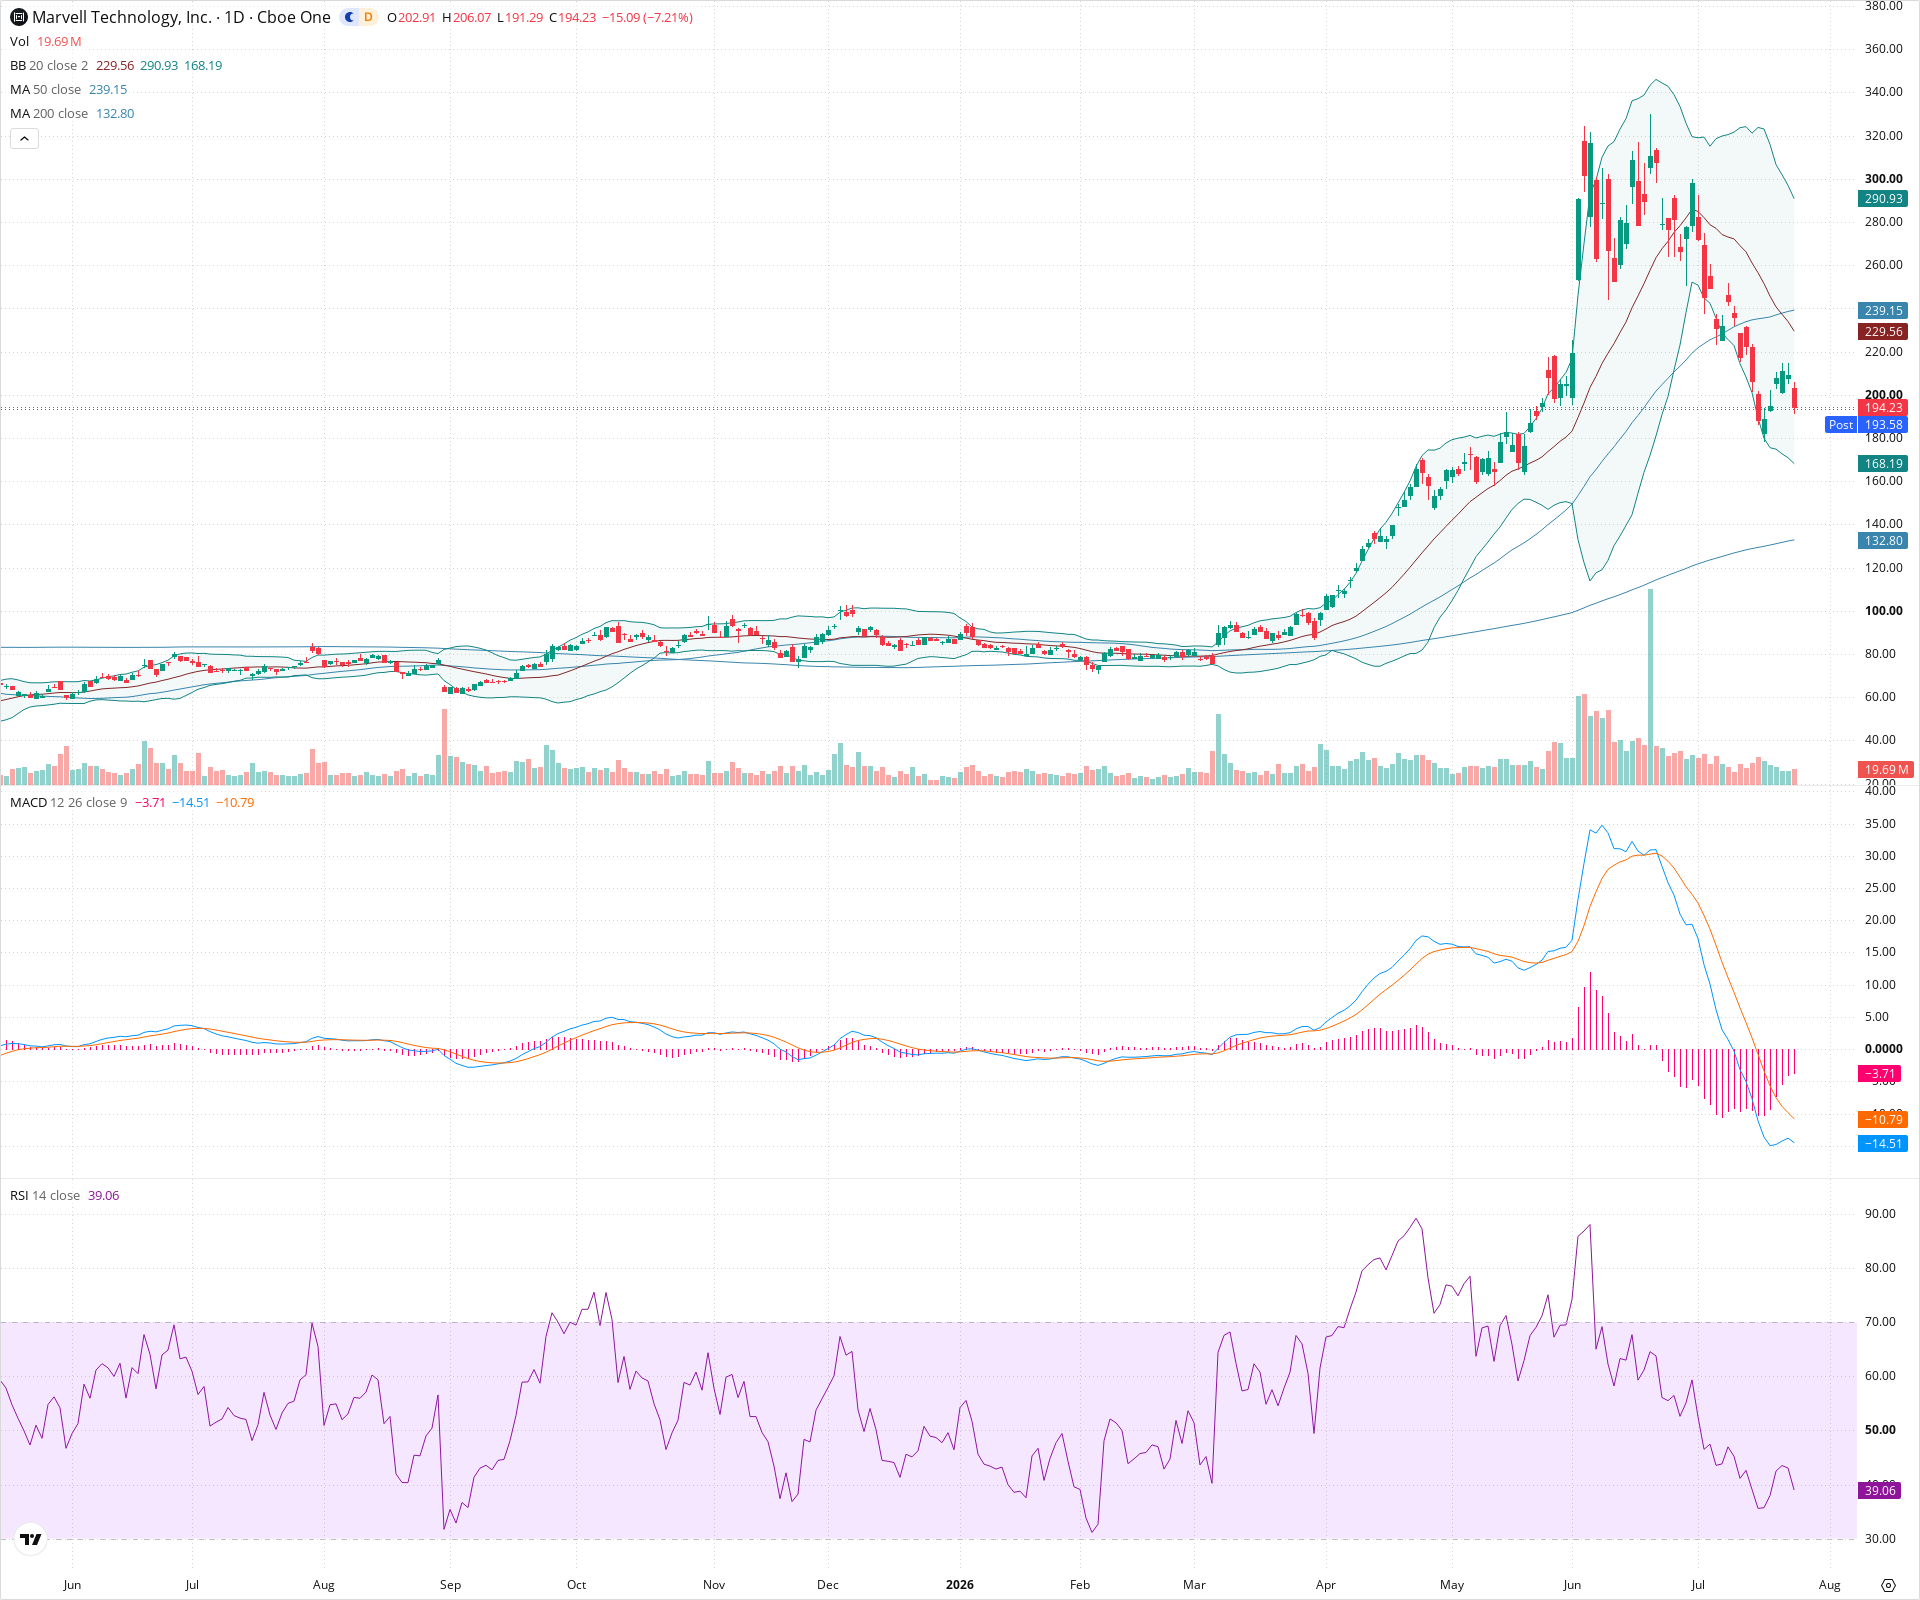
MRVL Daily Chart
Sentiment
Short-term Sentiment (days to weeks): Bearish
Price is in a steep and rapid downtrend, characterized by a series of large red candles breaking below the 50-day SMA and riding the lower Bollinger Band. Strong negative momentum is confirmed by a sharply falling RSI approaching oversold territory and an accelerating MACD with a deeply expanding negative histogram.
Long-term Sentiment (weeks to months): Bullish
Despite the severe short-term correction, the overarching long-term market structure remains technically intact. The 50-day SMA is positioned significantly above the rising 200-day SMA, indicating the broader macro trend is still upward, treating current action as a deep pullback within a larger bull cycle.
Report Metadata
- Timeframe: daily
- Generated at: 2026-07-24T21:16:55.699Z
- Model: gemini-3.1-pro-preview
Support Price Levels
| Level | Range | Strength | Notes |
|---|---|---|---|
| $170.00 | $160.00 - $180.00 | Weak | A previous area of consolidation and minor resistance in April and May that served as the launchpad for the final parabolic advance. |
| $135.00 | $130.00 - $140.00 | Strong | The zone surrounding the rising 200-day SMA, representing a major dynamic support level for the long-term trend. |
Resistance Price Levels
| Level | Range | Strength | Notes |
|---|---|---|---|
| $240.00 | $230.00 - $250.00 | Strong | Resistance area containing the falling 50-day SMA and recent minor swing highs formed during the current downtrend. |
| $290.00 | $280.00 - $300.00 | Strong | A significant prior consolidation zone before the final breakdown, also aligning with psychological round numbers. |
Potential Chart Patterns in Formation
| Strength | Pattern | Signal | Target | Details |
|---|---|---|---|---|
| Strong | Parabolic Blow-off Top | Bearish | N/A | An extreme, near-vertical price advance culminating in a sharp peak around 320-330, followed by a rapid and steep correction, indicating a dramatic shift in market psychology from euphoria to aggressive selling. |
| Strong | Falling Knife / Steep Downtrend | Bearish | N/A | A rapid sequence of lower highs and lower lows with expanding downward momentum, breaking key short-term moving averages with little to no bullish retracement. |
Frequently Asked Questions about MRVL
What is the current sentiment for MRVL?
The short-term sentiment for MRVL is currently Bearish because Price is in a steep and rapid downtrend, characterized by a series of large red candles breaking below the 50-day SMA and riding the lower Bollinger Band. Strong negative momentum is confirmed by a sharply falling RSI approaching oversold territory and an accelerating MACD with a deeply expanding negative histogram.. The long-term trend is classified as Bullish.
What are the key support levels for MRVL?
StockDips.AI has identified key support levels for MRVL at $170.00 and $135.00. These levels may represent potential accumulation zones where buying interest could emerge.
Is MRVL in a significant dip or a Value Dip right now?
MRVL has a Value Score of 65/100. It is not currently flagged as a significant dip in the Top Dips list. It is not listed as a Value Dip because the long-term sentiment or value-score threshold does not qualify.
View the full interactive analysis on StockDips.AI.