AMD Weekly Technical Analysis
Advanced Micro Devices Inc.
Designs CPUs and GPUs for PCs and data centers competing with Intel and NVIDIA.
AMD Technical Analysis Summary
AMD has recently concluded a massive parabolic rally with a classic blow-off top near the 700 level. The stock is currently undergoing a necessary and sharp mean-reversion correction, seeking to establish a new base of support. While short-term momentum is firmly downward, long-term investors should note that the macro structural uptrend remains entirely intact as long as major moving averages hold.
Included In Lists
Related Tickers of Interest
AMD Weekly Chart
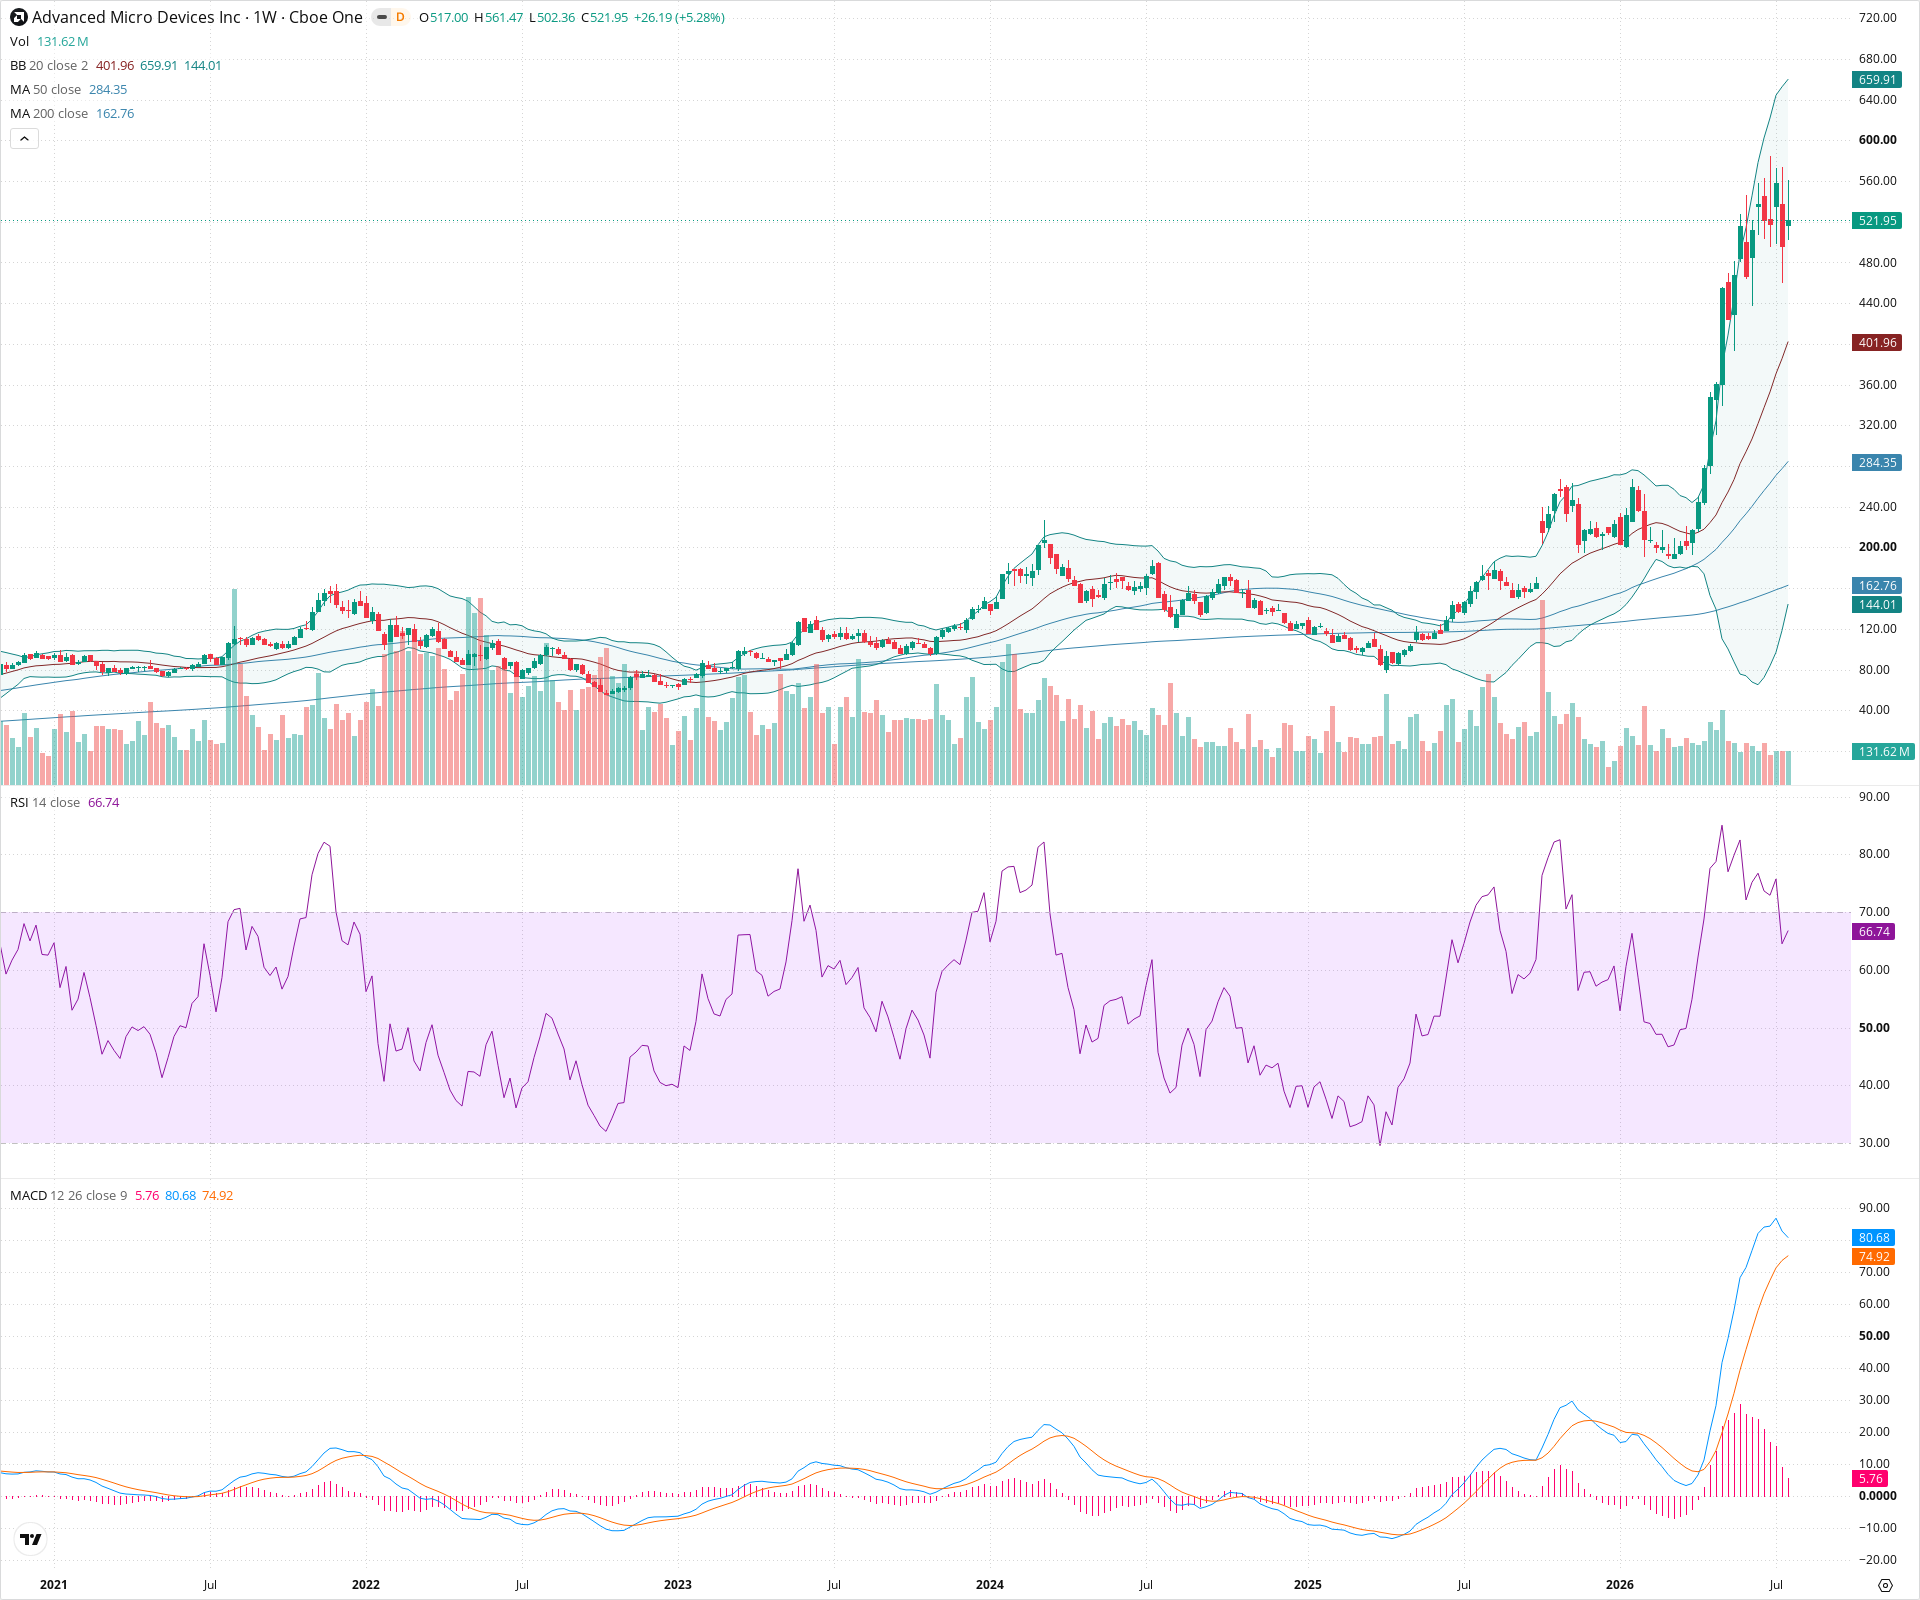
Sentiment
Short-term Sentiment (days to weeks): Bearish
The price is in a sharp corrective phase following a parabolic advance, characterized by large red weekly candles, a declining MACD histogram, and RSI dropping out of extreme overbought territory.
Long-term Sentiment (weeks to months): Bullish
Despite the current sharp pullback, the broader market structure remains in a strong macro uptrend, with the price maintaining a significant distance above the steeply rising 50-week and 200-week SMAs.
Report Metadata
- Timeframe: weekly
- Generated at: 2026-07-25T09:04:19.900Z
- Model: gemini-3.1-pro-preview
Support Price Levels
| Level | Range | Strength | Notes |
|---|---|---|---|
| $420.00 | $400.00 - $440.00 | Strong | Major prior consolidation zone before the final vertical markup, aligning closely with the rising 20-week SMA. |
| $300.00 | $280.00 - $320.00 | Weak | Intermediate structural swing high from the previous uptrend phase, sitting near the current 50-week SMA. |
Resistance Price Levels
| Level | Range | Strength | Notes |
|---|---|---|---|
| $580.00 | $560.00 - $600.00 | Weak | Immediate overhead resistance formed by the breakdown level of the recent descent. |
| $700.00 | $680.00 - $720.00 | Strong | The recent blow-off top and all-time high zone. |
Potential Chart Patterns in Formation
| Strength | Pattern | Signal | Target | Details |
|---|---|---|---|---|
| Strong | Parabolic Curve / Blow-off Top | Bearish | $400.00 | An extreme, nearly vertical price advance that ended with high volatility and a sharp reversal, indicating exhaustion of buyers. |
Frequently Asked Questions about AMD
What is the current sentiment for AMD?
The short-term sentiment for AMD is currently Bearish because The price is in a sharp corrective phase following a parabolic advance, characterized by large red weekly candles, a declining MACD histogram, and RSI dropping out of extreme overbought territory.. The long-term trend is classified as Bullish.
What are the key support levels for AMD?
StockDips.AI has identified key support levels for AMD at $420.00 and $300.00. These levels may represent potential accumulation zones where buying interest could emerge.
Is AMD in a significant dip or a Value Dip right now?
AMD has a Value Score of 61/100. It is not currently flagged as a significant dip in the Top Dips list. It is not listed as a Value Dip because the long-term sentiment or value-score threshold does not qualify.
View the full interactive analysis on StockDips.AI.