AVGO Weekly Technical Analysis
Broadcom Inc
Designs semiconductors and enterprise software following its VMware acquisition.
AVGO Technical Analysis Summary
AVGO is undergoing a significant weekly correction following a prolonged parabolic advance, with short-term momentum clearly bearish as evidenced by declining MACD and price falling below the 20-week SMA. The asset is currently testing critical support at the 50-week SMA (~$357); holding this level is vital to maintain the intermediate bullish structure. While the short-term picture requires caution, long-term investors may note the broader uptrend remains intact as long as price stays well above the $300 base.
Included In Lists
Related Tickers of Interest
AVGO Weekly Chart
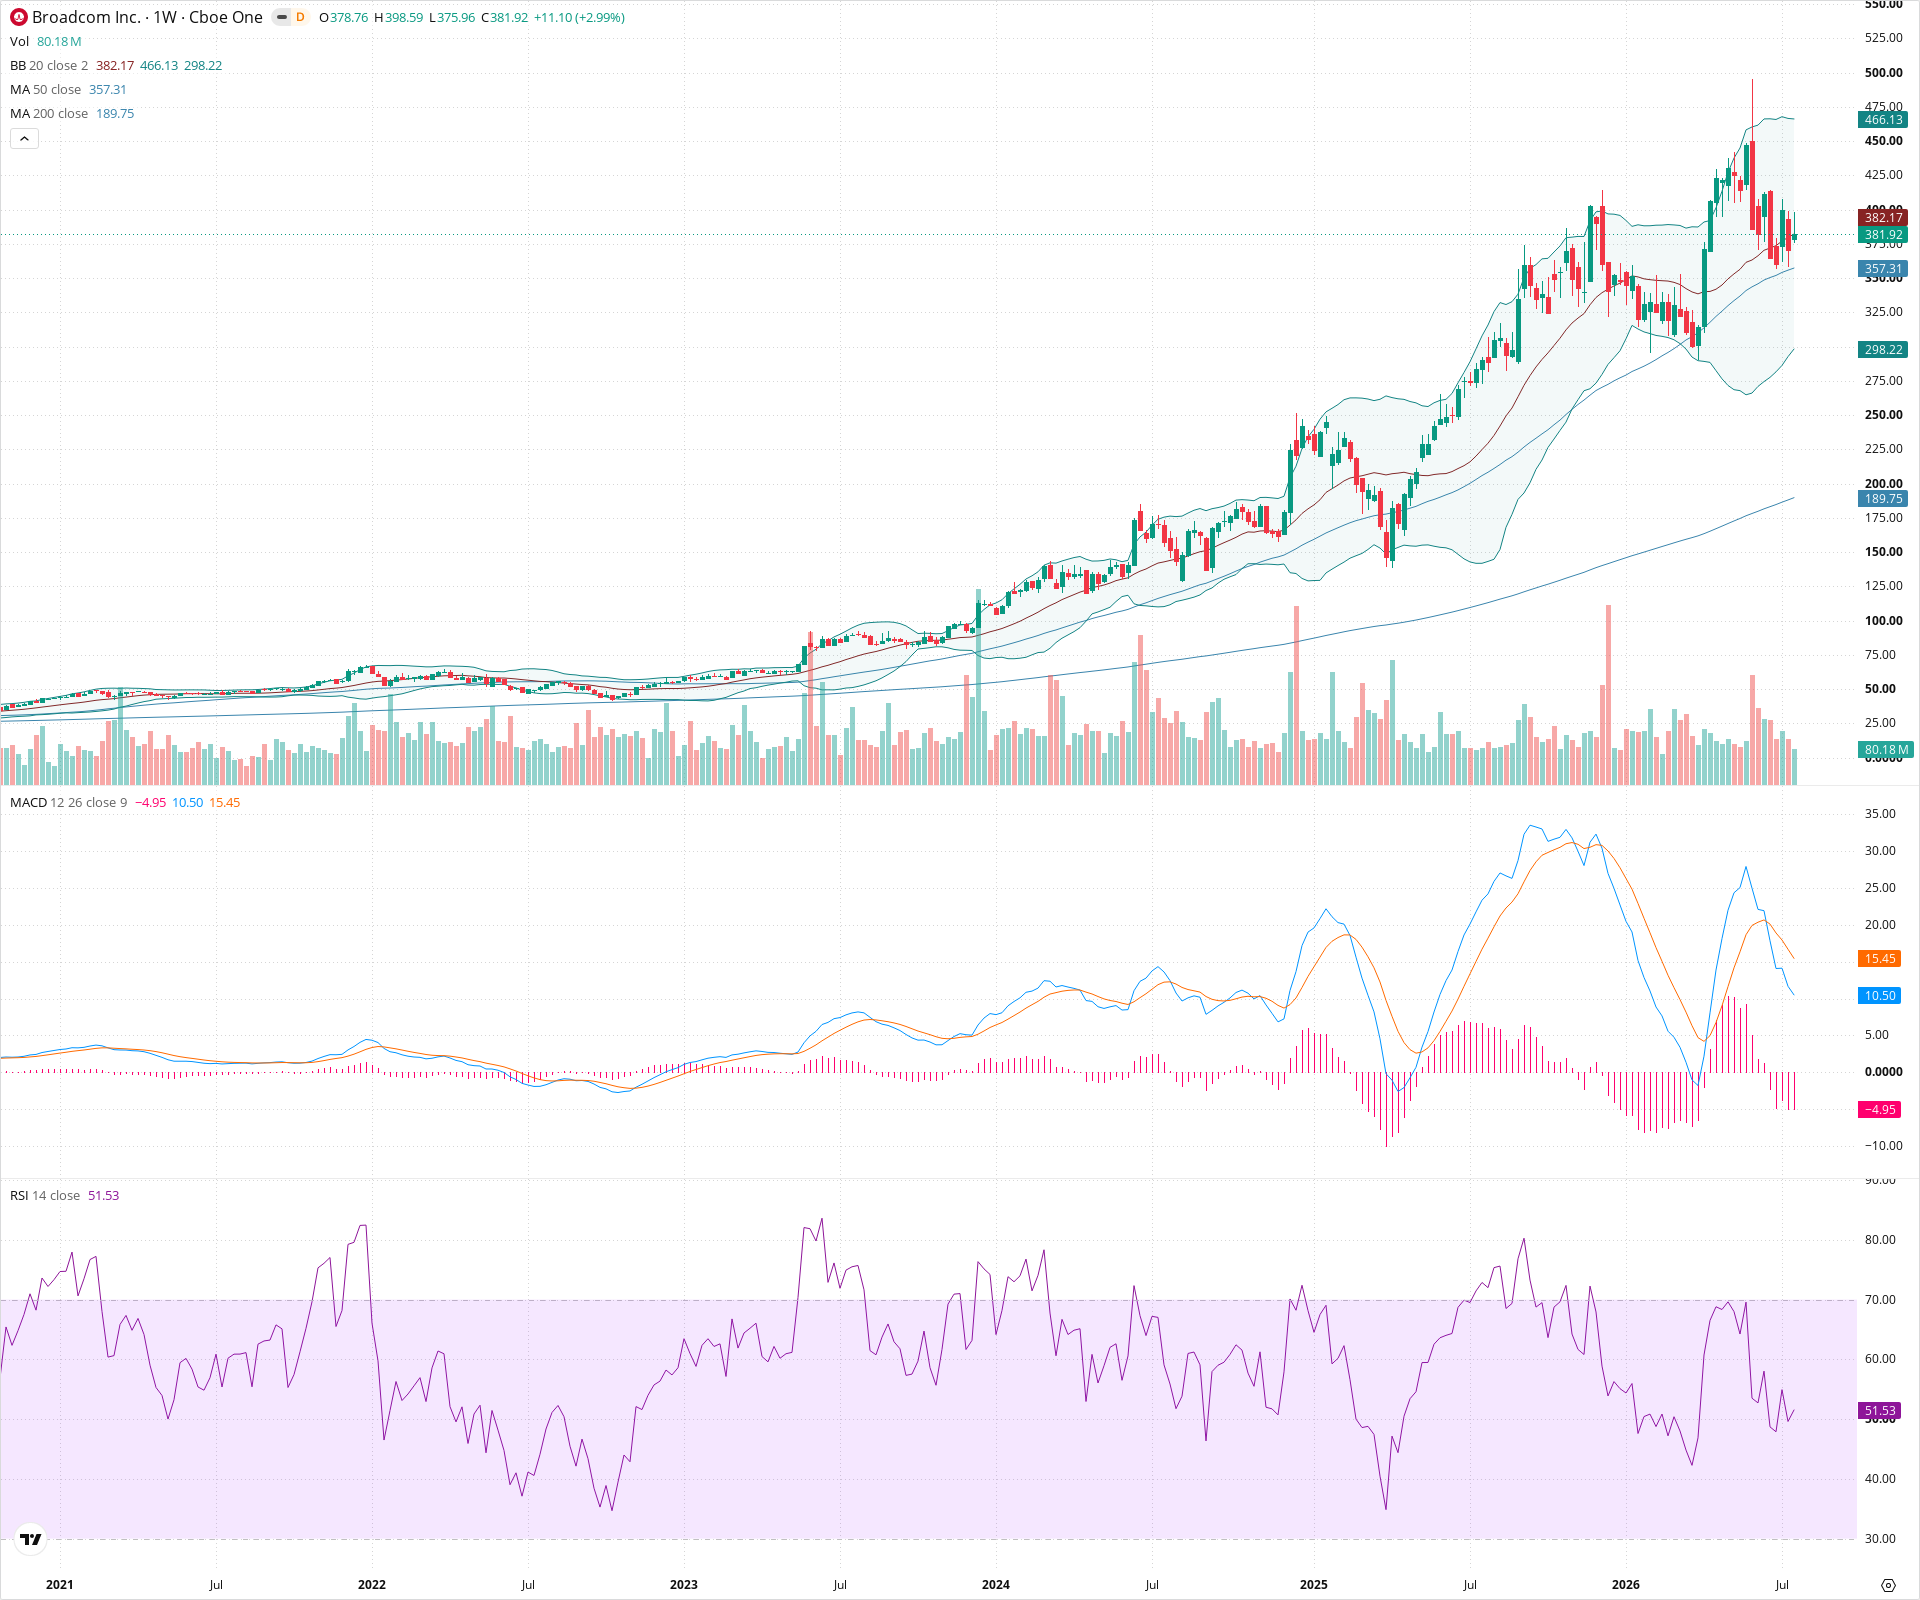
Sentiment
Short-term Sentiment (days to weeks): Bearish
Price has broken below the 20-week SMA, is making lower highs and lower lows since the peak, and the MACD histogram is expanding negatively.
Long-term Sentiment (weeks to months): Bullish
Despite the current deep correction, the overall multi-year structure is a strong uptrend, and the price remains significantly above the rising 200-week SMA.
Report Metadata
- Timeframe: weekly
- Generated at: 2026-07-25T09:02:13.554Z
- Model: gemini-3.1-pro-preview
Support Price Levels
| Level | Range | Strength | Notes |
|---|---|---|---|
| $357.50 | $350.00 - $365.00 | Strong | Current test area; confluence of recent swing lows and the rising 50-week SMA. |
| $287.50 | $275.00 - $300.00 | Strong | Major prior consolidation zone before the most recent parabolic advance. |
Resistance Price Levels
| Level | Range | Strength | Notes |
|---|---|---|---|
| $407.50 | $400.00 - $415.00 | Strong | Initial resistance at the declining 20-week SMA and recent lower highs. |
| $462.50 | $450.00 - $475.00 | Strong | The all-time high resistance zone. |
Potential Chart Patterns in Formation
| Strength | Pattern | Signal | Target | Details |
|---|---|---|---|---|
| Strong | Corrective Downtrend | Bearish | N/A | A clear series of lower highs and lower lows forming a downward channel since the all-time high, correcting the prior parabolic move. |
Frequently Asked Questions about AVGO
What is the current sentiment for AVGO?
The short-term sentiment for AVGO is currently Bearish because Price has broken below the 20-week SMA, is making lower highs and lower lows since the peak, and the MACD histogram is expanding negatively.. The long-term trend is classified as Bullish.
What are the key support levels for AVGO?
StockDips.AI has identified key support levels for AVGO at $357.50 and $287.50. These levels may represent potential accumulation zones where buying interest could emerge.
Is AVGO in a significant dip or a Value Dip right now?
AVGO has a Value Score of 48/100. It is not currently flagged as a significant dip in the Top Dips list. It is not listed as a Value Dip because the long-term sentiment or value-score threshold does not qualify.
View the full interactive analysis on StockDips.AI.