CBRS Weekly Technical Analysis
Cerebras Systems
Cerebras Systems is an artificial intelligence infrastructure company that designs and manufactures high-performance AI computing platforms. Instead of traditional small graphics processing units (GPUs), the company builds the world's largest computer chips, known as Wafer-Scale Engines (WSE), which use an entire silicon wafer as a single processor to eliminate communication delays.
CBRS Technical Analysis Summary
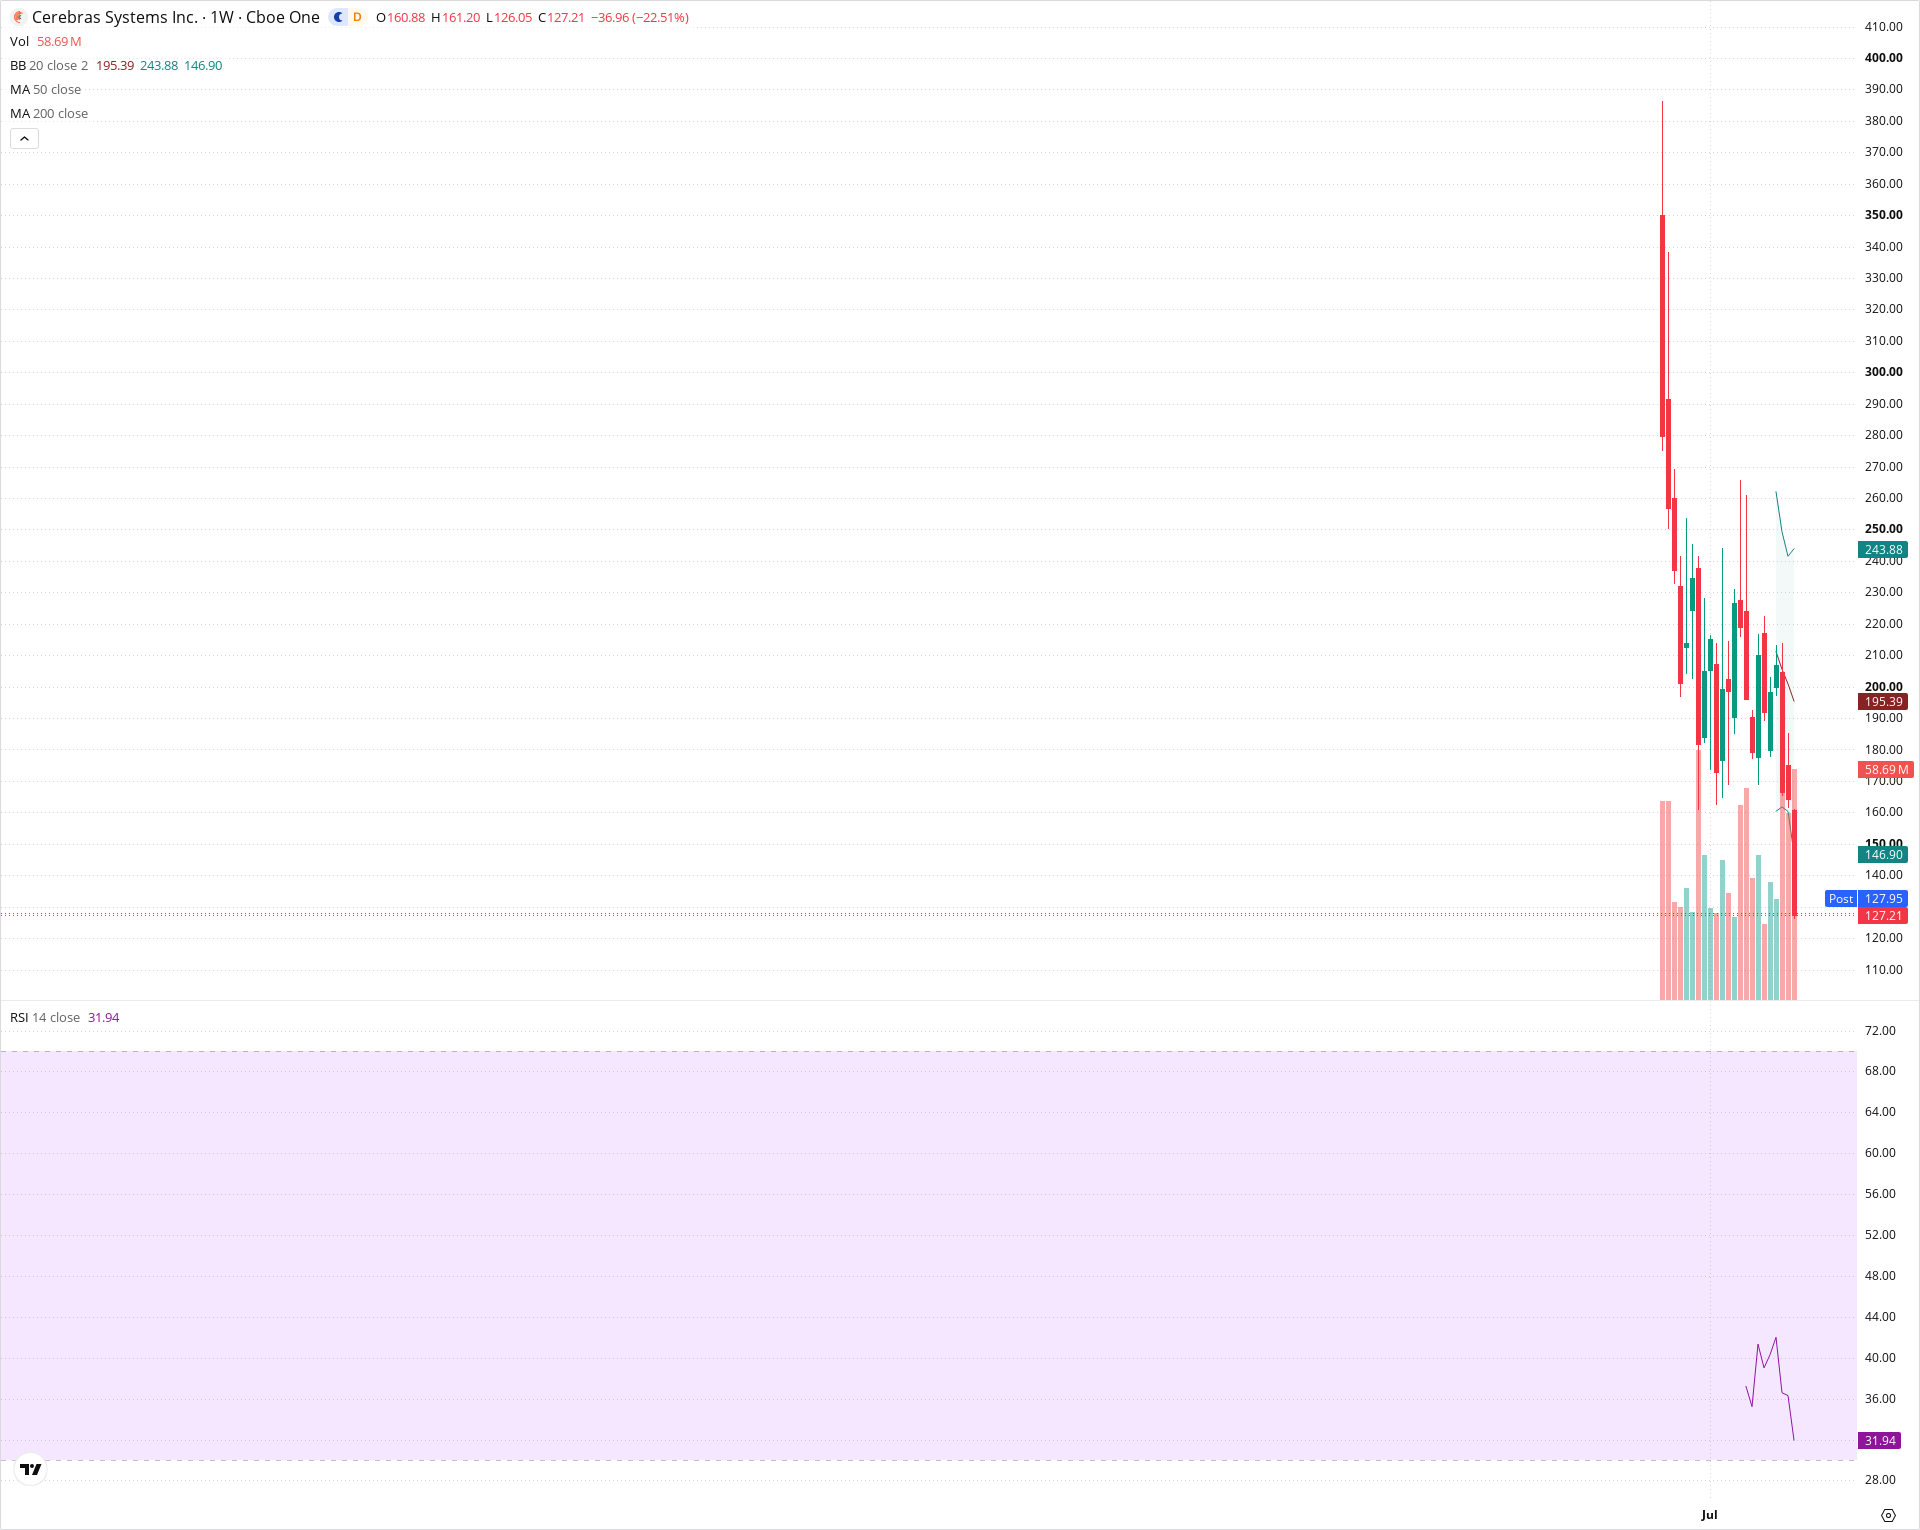
CBRS remains in a decisive weekly downtrend, accelerating lower after breaking through previous consolidation support near 170.00. Price is pressing into new lows below the lower Bollinger Band with high selling volume and an oversold RSI of 31.94. A sustained recovery above the 145.00-150.00 area is required before any meaningful stabilization can occur.
Included In Lists
Related Tickers of Interest
CBRS Weekly Chart
Sentiment
Short-term Sentiment (days to weeks): Bearish
Price is in a severe downward expansion, breaking below the lower Bollinger Band (146.90) on elevated volume with RSI dropping towards 31.94.
Long-term Sentiment (weeks to months): Bearish
Persistent structural decline marked by consecutive lower highs and lower lows since the initial spike, establishing new all-time visible lows.
Report Metadata
- Timeframe: weekly
- Generated at: 2026-10-16T21:07:33.536Z
- Model: gemini-3.8-flash
Support Price Levels
| Level | Range | Strength | Notes |
|---|---|---|---|
| $123.03 | $120.00 - $126.05 | Weak | Current weekly low and psychological support zone in active price discovery to the downside. |
| $105.00 | $100.00 - $110.00 | Moderate | Major psychological round-number area below current price levels. |
Resistance Price Levels
| Level | Range | Strength | Notes |
|---|---|---|---|
| $147.50 | $145.00 - $150.00 | Moderate | Former support zone and lower Bollinger Band line now acting as immediate overhead resistance. |
| $175.00 | $170.00 - $180.00 | Strong | Prior consolidation baseline breakdown level and significant multi-week shelf. |
| $200.00 | $195.00 - $205.00 | Strong | Confluence of the 20-week Bollinger Band middle line (195.39) and major prior resistance. |
Potential Chart Patterns in Formation
| Strength | Pattern | Signal | Target | Details |
|---|---|---|---|---|
| Strong | Horizontal Support Breakdown | Bearish | $110.00 | Decisive weekly close below the previous swing low shelf around 170.00, triggering an accelerated downside move. |
| Moderate | Bollinger Band Walking Down | Bearish | N/A | Candles expanding and closing below the lower 2-sigma band, indicating high-momentum downside continuation. |
Frequently Asked Questions about CBRS
What is the current sentiment for CBRS?
The short-term sentiment for CBRS is currently Bearish because Price is in a severe downward expansion, breaking below the lower Bollinger Band (146.90) on elevated volume with RSI dropping towards 31.94.. The long-term trend is classified as Bearish.
What are the key support levels for CBRS?
StockDips.AI has identified key support levels for CBRS at $123.03 and $105.00. These levels may represent potential accumulation zones where buying interest could emerge.
Is CBRS in a significant dip or a Value Dip right now?
CBRS has a Value Score of 84/100. It is currently flagged as a significant dip in the Top Dips list. It is not listed as a Value Dip because the long-term sentiment or value-score threshold does not qualify.
View the full interactive analysis on StockDips.AI.