CPRT Daily Technical Analysis
Copart Inc
Online vehicle auction platform connecting insurers, dealers, and buyers.
CPRT Technical Analysis Summary
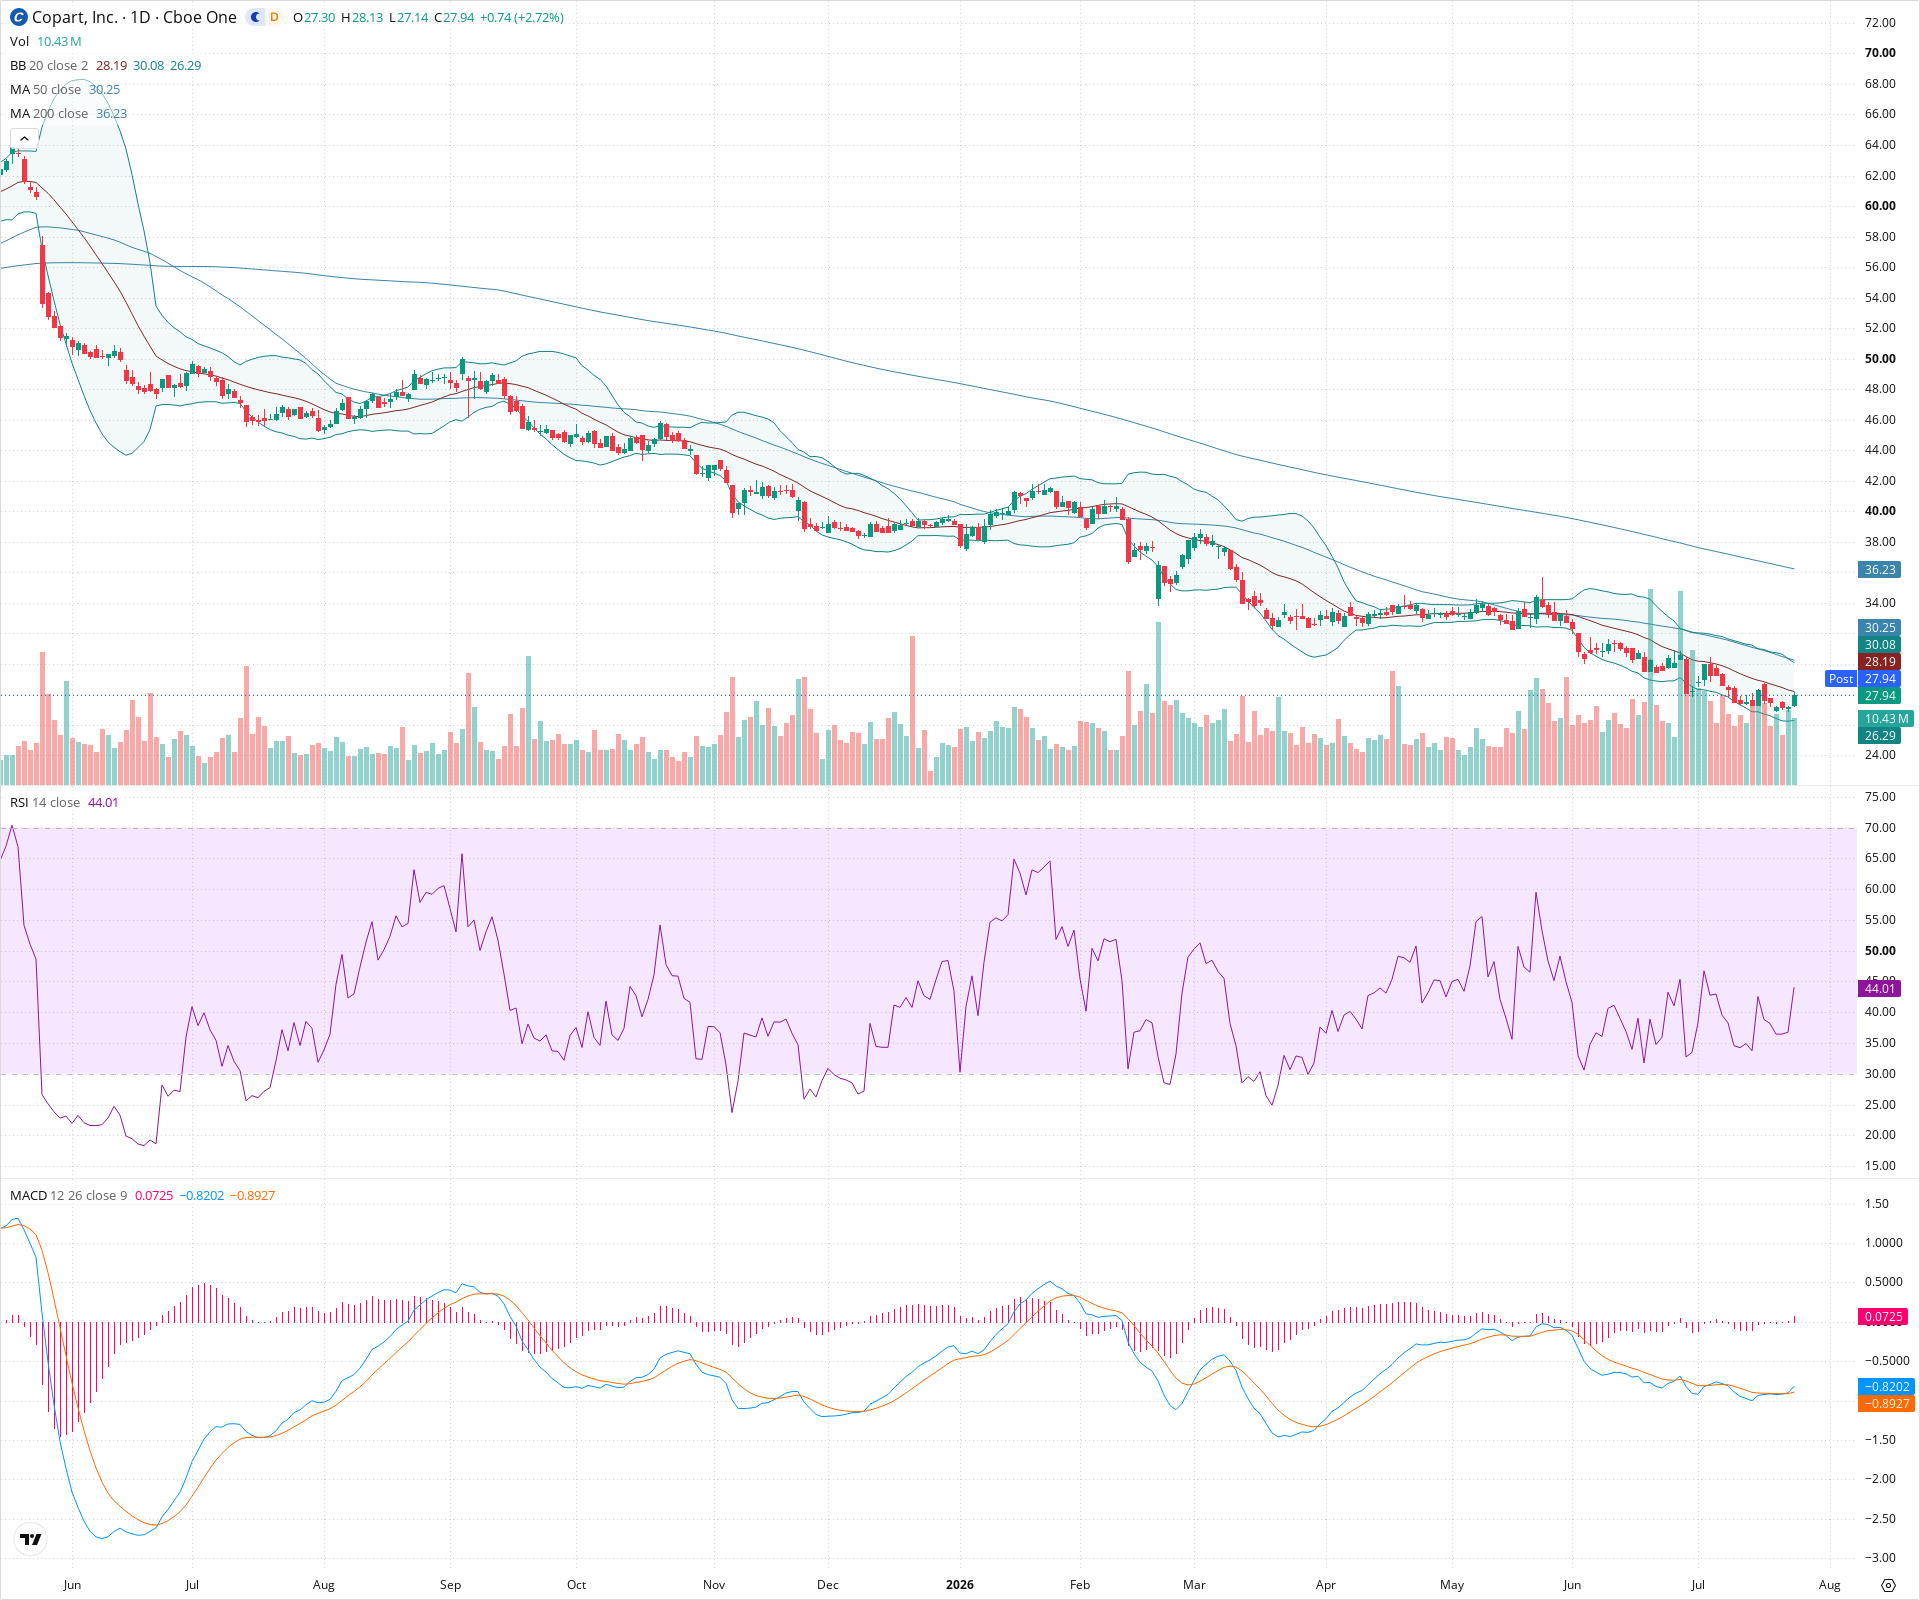
Copart (CPRT) remains locked in a severe long-term downtrend, trading well below its declining 50-day and 200-day moving averages. While a recent bullish MACD crossover and a bounce from lows suggest potential for a short-term relief rally, the overarching market structure is strongly bearish. Long-term investors should approach with caution, as significant technical damage has occurred, and a sustained break above key resistance levels like the 50-day SMA would be needed to suggest a true trend reversal.
Included In Lists
Related Tickers of Interest
CPRT Daily Chart
Sentiment
Short-term Sentiment (days to weeks): Bullish
Price has recently bounced from swing lows with a strong green candle, supported by a bullish crossover in the MACD and RSI rising from near-oversold territory, indicating a potential short-term relief rally.
Long-term Sentiment (weeks to months): Bearish
The chart displays a pronounced and sustained downtrend characterized by lower highs and lower lows. Price remains significantly below the downward-sloping 50-day and 200-day simple moving averages, confirming strong long-term bearish momentum.
Report Metadata
- Timeframe: daily
- Generated at: 2026-07-24T21:09:31.198Z
- Model: gemini-3.1-pro-preview
Support Price Levels
| Level | Range | Strength | Notes |
|---|---|---|---|
| $26.25 | $26.00 - $26.50 | Strong | Recent major swing low zone and confluence with the lower Bollinger Band area, which has recently acted as a bounce point. |
Resistance Price Levels
| Level | Range | Strength | Notes |
|---|---|---|---|
| $28.25 | $28.00 - $28.50 | Weak | Immediate overhead resistance near the 20-day SMA and recent minor consolidation levels. |
| $30.50 | $30.00 - $31.00 | Strong | Significant resistance zone defined by the declining 50-day SMA and a previous consolidation period before a leg down. |
| $35.75 | $35.00 - $36.50 | Strong | Major structural resistance zone aligning with prior swing highs and the current position of the 200-day SMA. |
Potential Chart Patterns in Formation
| Strength | Pattern | Signal | Target | Details |
|---|---|---|---|---|
| Strong | Long-term Downtrend | Bearish | N/A | A clear, overarching pattern of lower highs and lower lows dominating the visible chart, with price consistently failing to reclaim major moving averages. |
| Weak | Potential Short-term Base | Neutral | N/A | Recent price action shows signs of halting the immediate decline, forming a cluster of support near 26.00, accompanied by improving short-term momentum indicators. |
Frequently Asked Questions about CPRT
What is the current sentiment for CPRT?
The short-term sentiment for CPRT is currently Bullish because Price has recently bounced from swing lows with a strong green candle, supported by a bullish crossover in the MACD and RSI rising from near-oversold territory, indicating a potential short-term relief rally.. The long-term trend is classified as Bearish.
What are the key support levels for CPRT?
StockDips.AI has identified key support levels for CPRT at $26.25. These levels may represent potential accumulation zones where buying interest could emerge.
Is CPRT in a significant dip or a Value Dip right now?
CPRT has a Value Score of 16/100. It is not currently flagged as a significant dip in the Top Dips list. It is not listed as a Value Dip because the long-term sentiment or value-score threshold does not qualify.
View the full interactive analysis on StockDips.AI.