SMCI Daily Technical Analysis
Super Micro Computer Inc
Builds high-performance servers and storage used in AI and cloud computing.
SMCI Technical Analysis Summary
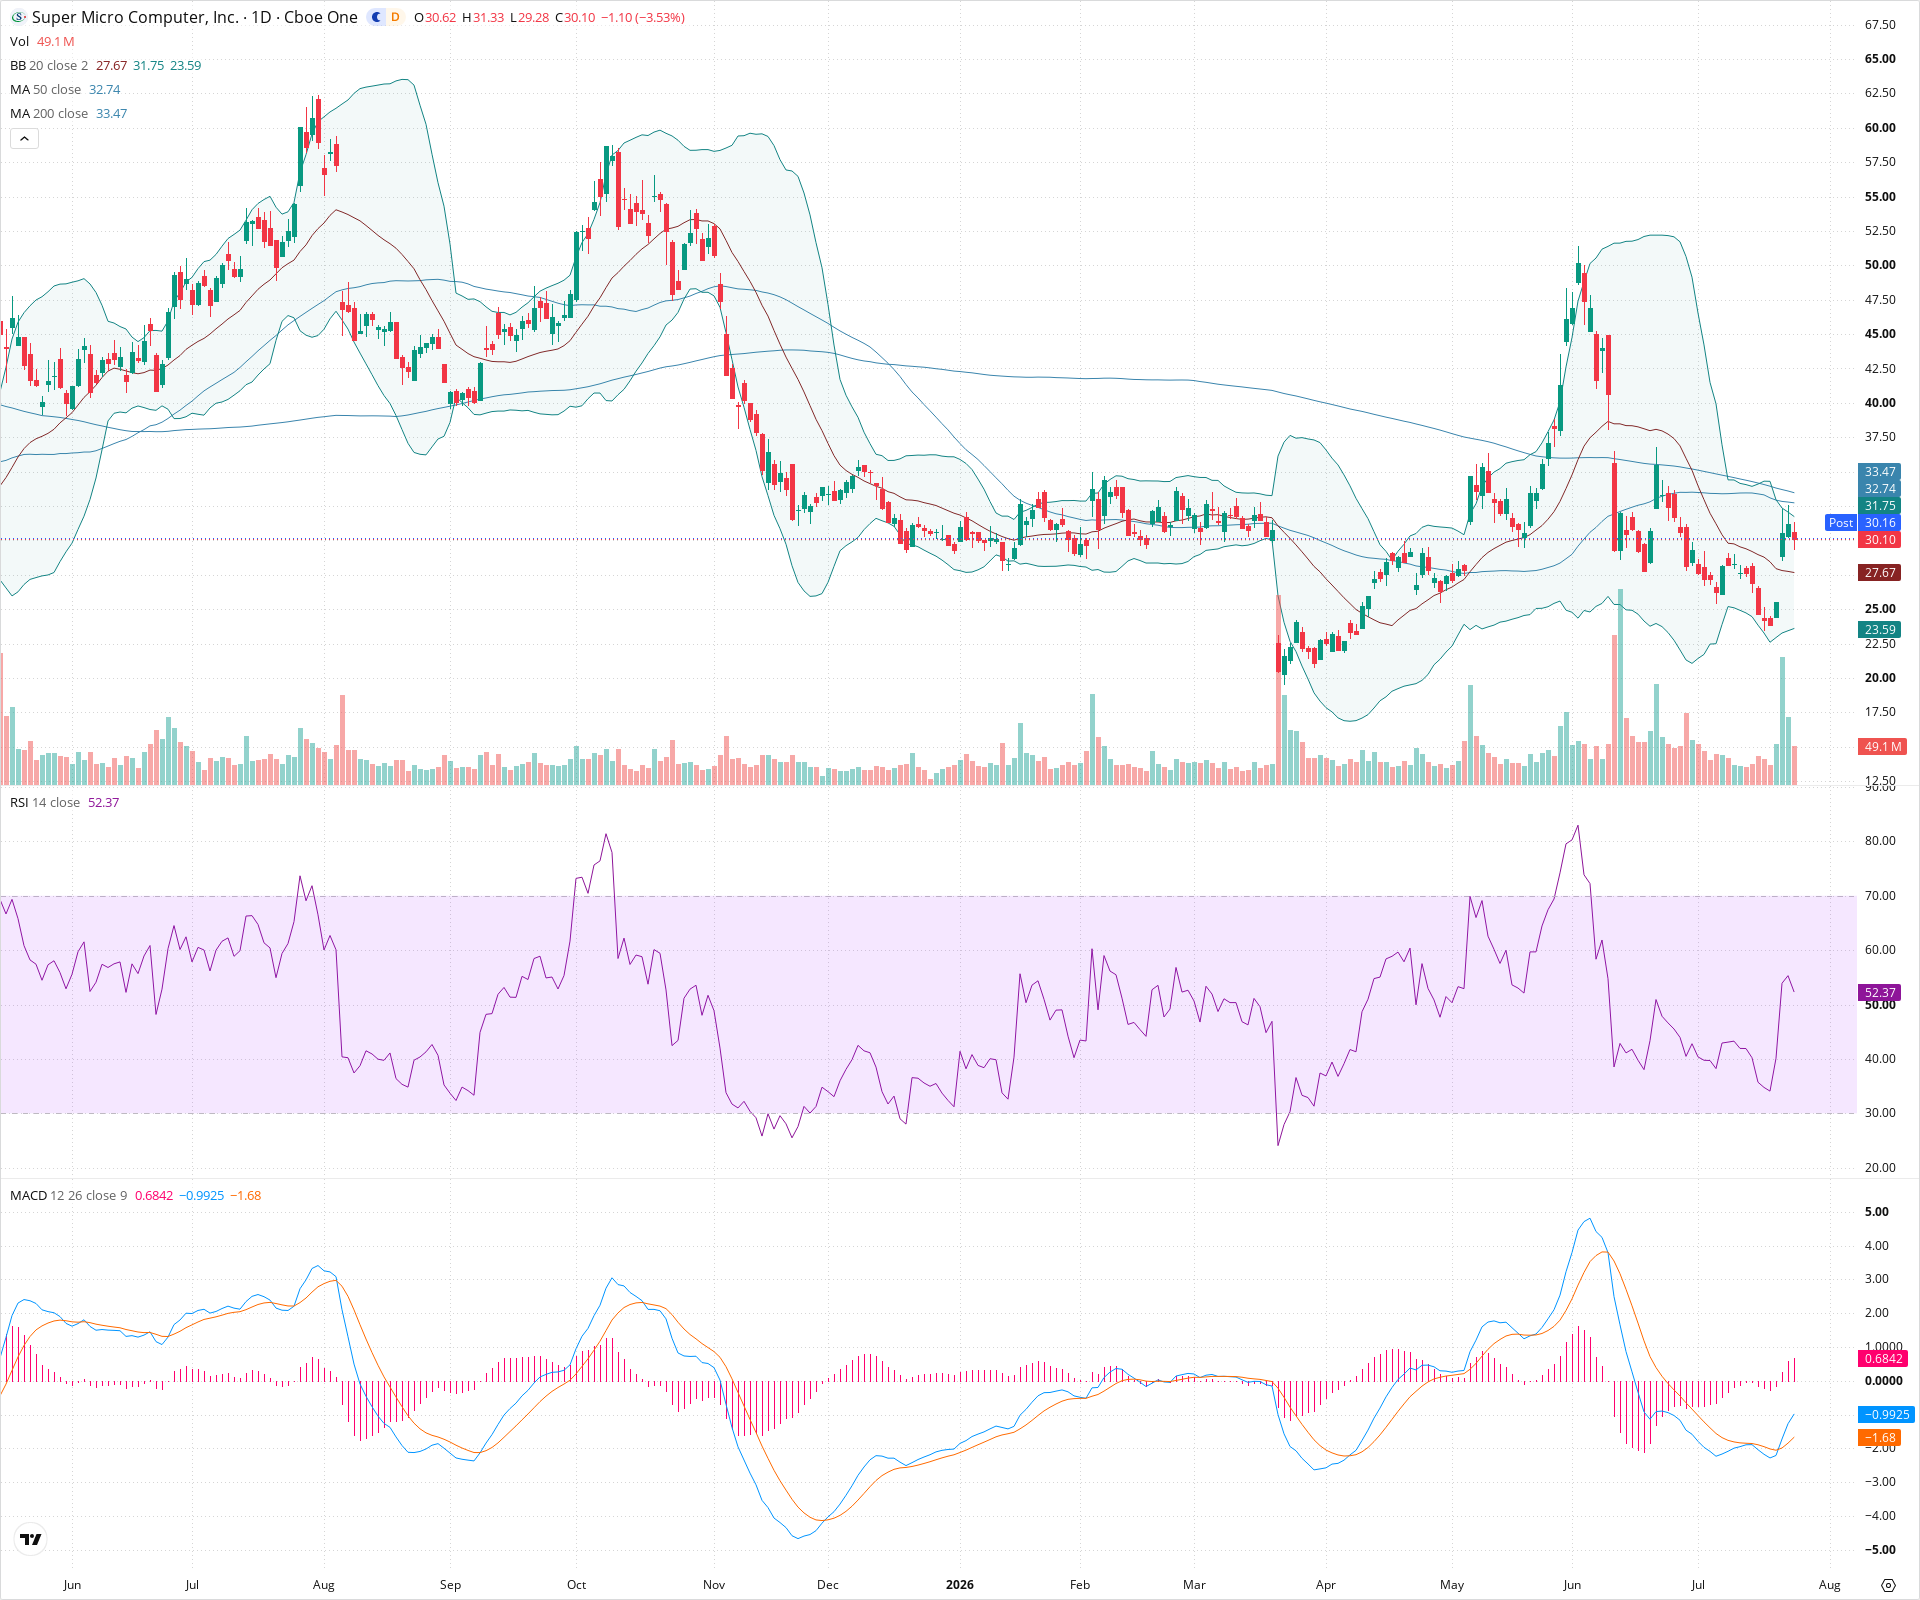
SMCI remains in a clear long-term downtrend, characterized by price action below declining major moving averages. While the stock has staged a notable short-term relief rally from its recent lows, it is currently facing a formidable resistance cluster formed by the 50-day and 200-day SMAs. Until price can decisively reclaim this MA cluster, the broader technical structure favors the bears.
Included In Lists
Related Tickers of Interest
SMCI Daily Chart
Sentiment
Short-term Sentiment (days to weeks): Neutral
Price has rebounded from recent lows and is trading above the 20-day SMA, but upward momentum is stalling as it approaches significant overhead resistance at the 50-day and 200-day SMAs. The MACD histogram is positive but beginning to contract.
Long-term Sentiment (weeks to months): Bearish
The broader trend remains negative, with price trading below both the 50-day and 200-day SMAs, and the 50-day SMA positioned below the 200-day SMA, indicating sustained long-term weakness.
Report Metadata
- Timeframe: daily
- Generated at: 2026-07-24T21:07:12.299Z
- Model: gemini-3.1-pro-preview
Support Price Levels
| Level | Range | Strength | Notes |
|---|---|---|---|
| $27.50 | $27.00 - $28.00 | Weak | Near-term support zone aligning with the 20-day SMA and the middle Bollinger Band. |
| $23.25 | $22.50 - $24.00 | Strong | Major recent swing low that acted as a strong base for the current relief rally. |
Resistance Price Levels
| Level | Range | Strength | Notes |
|---|---|---|---|
| $33.25 | $32.50 - $34.00 | Strong | A heavy resistance cluster containing the 50-day SMA, the 200-day SMA, and recent local swing highs. |
| $37.75 | $37.00 - $38.50 | Moderate | Previous consolidation and support zone that broke down, now likely to act as resistance on further upside. |
Potential Chart Patterns in Formation
| Strength | Pattern | Signal | Target | Details |
|---|---|---|---|---|
| Moderate | Relief Rally | Neutral | N/A | A counter-trend bounce recovering from deeply oversold levels, now testing major descending moving averages. |
Frequently Asked Questions about SMCI
What is the current sentiment for SMCI?
The short-term sentiment for SMCI is currently Neutral because Price has rebounded from recent lows and is trading above the 20-day SMA, but upward momentum is stalling as it approaches significant overhead resistance at the 50-day and 200-day SMAs. The MACD histogram is positive but beginning to contract.. The long-term trend is classified as Bearish.
What are the key support levels for SMCI?
StockDips.AI has identified key support levels for SMCI at $27.50 and $23.25. These levels may represent potential accumulation zones where buying interest could emerge.
Is SMCI in a significant dip or a Value Dip right now?
SMCI has a Value Score of 55/100. It is not currently flagged as a significant dip in the Top Dips list. It is not listed as a Value Dip because the long-term sentiment or value-score threshold does not qualify.
View the full interactive analysis on StockDips.AI.