IJH Daily Technical Analysis
US Mid Cap Index (400)
iShares Core S&P Mid-Cap ETF - Provides exposure to mid-sized U.S. companies in the S&P MidCap 400 index.
IJH Technical Analysis Summary
IJH maintains a robust long-term bullish trend, strongly supported by favorable moving average alignments and higher structural lows. The ETF is presently in a healthy corrective phase, consolidating its recent strong advance near the 50-day moving average. With short-term momentum indicators neutralizing rather than accelerating downwards, the current price action appears to be a natural pause, keeping the broader technical outlook constructive for long-term investors.
Included In Lists
Related Tickers of Interest
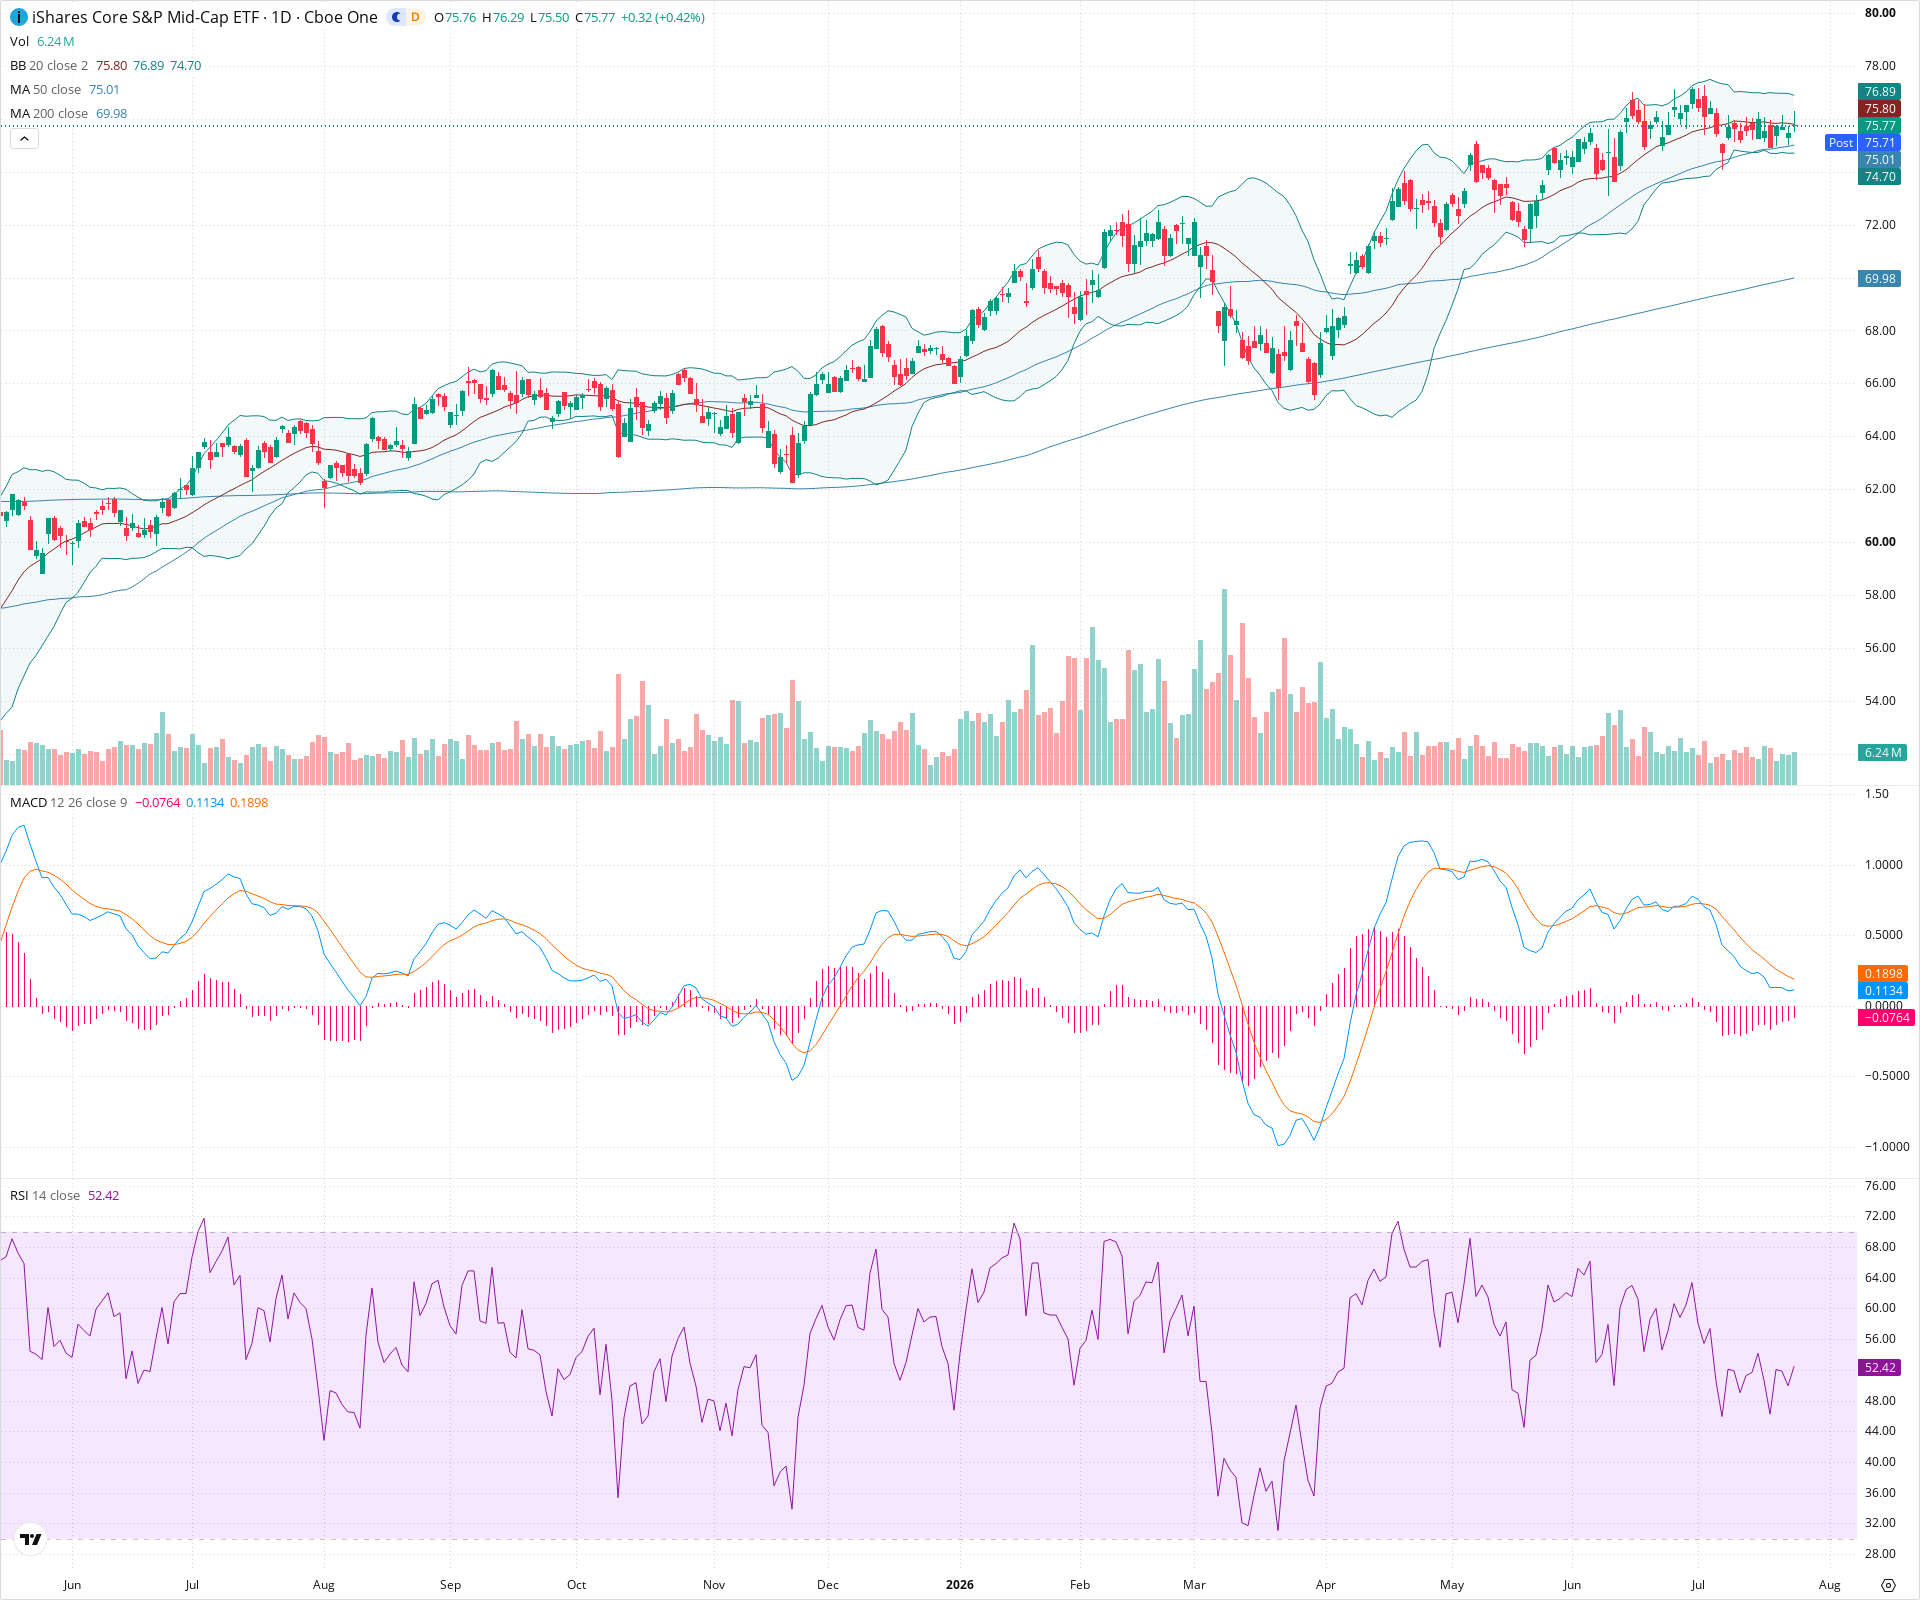
IJH Daily Chart
Sentiment
Short-term Sentiment (days to weeks): Neutral
Price is currently consolidating in a narrow range, oscillating between the 20-day and 50-day moving averages following a recent pullback. The RSI is flat near the midpoint of 50. While the MACD indicates a bearish crossover, the contracting negative histogram suggests that downward momentum is waning, resulting in a balanced short-term picture.
Long-term Sentiment (weeks to months): Bullish
The chart exhibits a clear, enduring uptrend defined by a series of higher highs and higher lows. The price is trading above a rising 200-day moving average, and the 50-day moving average is positively sloped above the 200-day, confirming a strong long-term bullish market structure.
Report Metadata
- Timeframe: daily
- Generated at: 2026-07-24T21:02:45.798Z
- Model: gemini-3.1-pro-preview
Support Price Levels
| Level | Range | Strength | Notes |
|---|---|---|---|
| $74.90 | $74.60 - $75.20 | Strong | Immediate support zone established by recent swing lows, consolidating price action, and the presence of the rising 50-day moving average. |
| $72.00 | $71.50 - $72.50 | Strong | A significant structural support area formed by a previous prolonged consolidation zone and key swing lows from April and May. |
| $70.00 | $69.50 - $70.50 | Strong | Major long-term support defined by the trajectory of the 200-day moving average and the structural lows formed in March and April. |
Resistance Price Levels
| Level | Range | Strength | Notes |
|---|---|---|---|
| $76.85 | $76.50 - $77.20 | Weak | Minor near-term resistance created by recent lower highs during the current sideways consolidation phase. |
| $78.15 | $77.80 - $78.50 | Strong | Significant overhead resistance marked by the recent multi-month peak and the upper boundary of the price expansion before the current pullback. |
Potential Chart Patterns in Formation
| Strength | Pattern | Signal | Target | Details |
|---|---|---|---|---|
| Weak | Bullish Consolidation | Bullish | N/A | The price action is moving sideways to slightly lower in a choppy fashion following a strong impulsive move upwards. This represents a digestion of recent gains near the 50-day moving average, resembling a potential bull flag formation. |
Frequently Asked Questions about IJH
What is the current sentiment for IJH?
The short-term sentiment for IJH is currently Neutral because Price is currently consolidating in a narrow range, oscillating between the 20-day and 50-day moving averages following a recent pullback. The RSI is flat near the midpoint of 50. While the MACD indicates a bearish crossover, the contracting negative histogram suggests that downward momentum is waning, resulting in a balanced short-term picture.. The long-term trend is classified as Bullish.
What are the key support levels for IJH?
StockDips.AI has identified key support levels for IJH at $74.90 and $72.00. These levels may represent potential accumulation zones where buying interest could emerge.
Is IJH in a significant dip or a Value Dip right now?
IJH has a Value Score of 55/100. It is not currently flagged as a significant dip in the Top Dips list. It is not listed as a Value Dip because the long-term sentiment or value-score threshold does not qualify.
View the full interactive analysis on StockDips.AI.