EEM Daily Technical Analysis
Emerging Markets ETF
iShares MSCI Exchange-Traded Fund designed to track the performance of large- and mid-cap stocks across emerging market countries, including China, Taiwan, India, Brazil, and South Africa. Often used as a macro indicator for global risk appetite and emerging-market sentiment.
EEM Technical Analysis Summary
EEM has experienced a significant short-term correction, breaking below a potential Head and Shoulders neckline and losing the support of its 20-day and 50-day moving averages. Short-term momentum is firmly bearish. However, long-term investors will note that the broader uptrend remains technically intact as long as the price holds above the critical 200-day SMA support zone near 60.
Included In Lists
Related Tickers of Interest
EEM Daily Chart
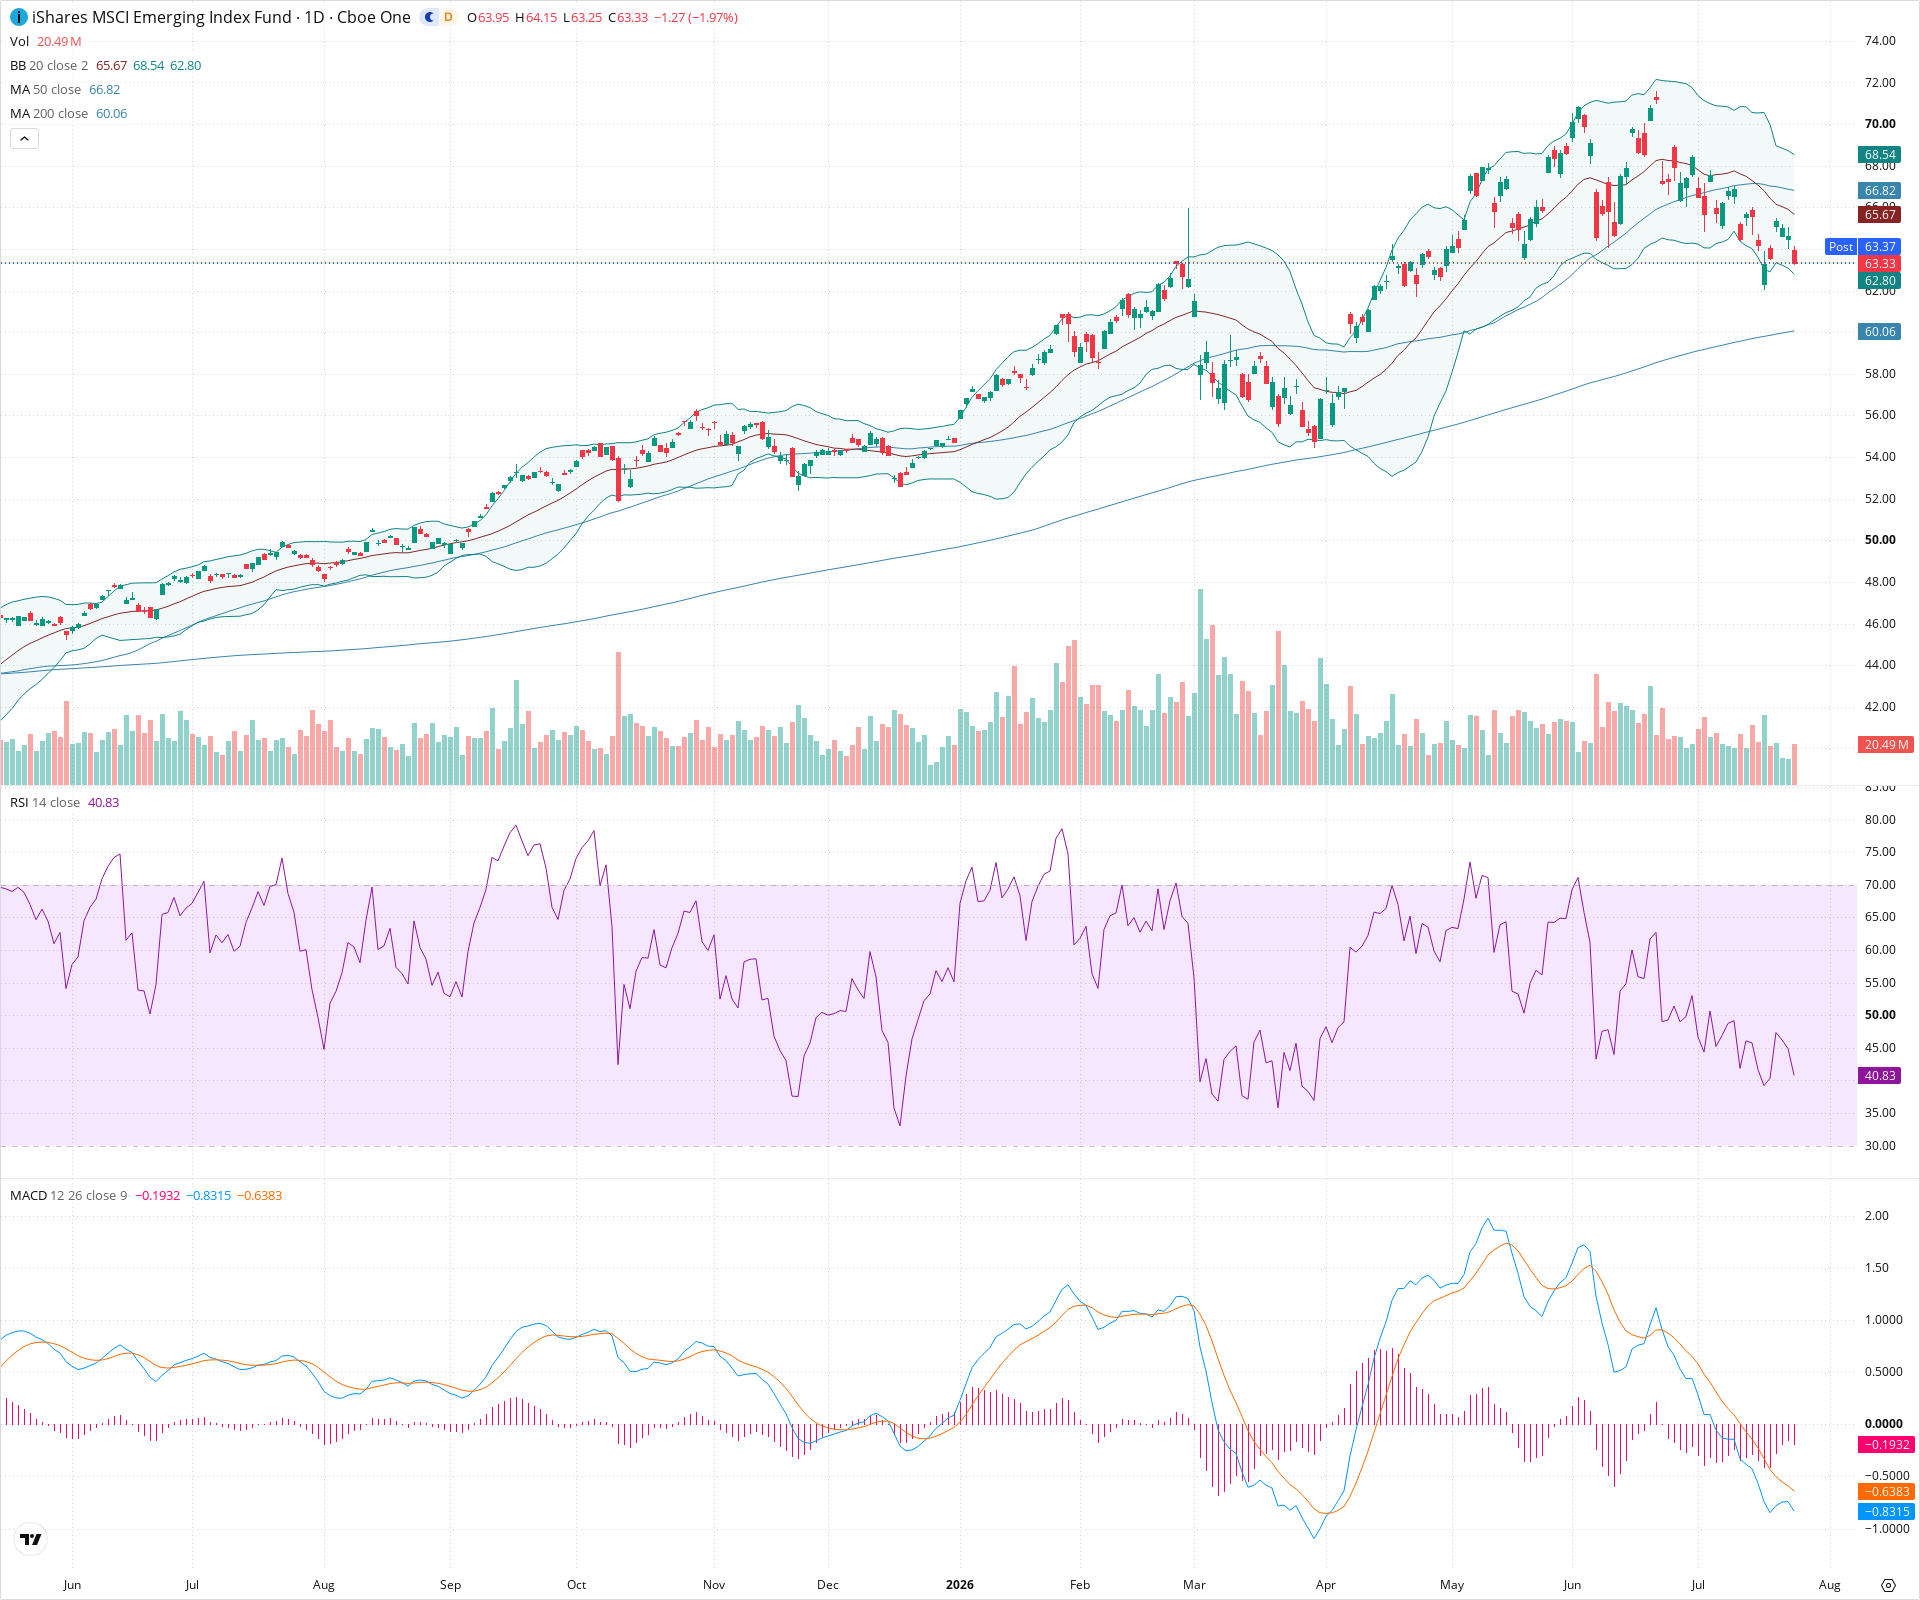
Sentiment
Short-term Sentiment (days to weeks): Bearish
Price is in a sharp short-term downtrend, trading below both the 20-day and 50-day SMAs. Momentum indicators confirm this, with a negative and expanding MACD histogram and an RSI falling towards oversold territory.
Long-term Sentiment (weeks to months): Bullish
Despite the severe recent correction, the price remains above a steadily rising 200-day SMA, keeping the broader long-term market structure intact for now.
Report Metadata
- Timeframe: daily
- Generated at: 2026-07-24T21:07:47.999Z
- Model: gemini-3.1-pro-preview
Support Price Levels
| Level | Range | Strength | Notes |
|---|---|---|---|
| $63.00 | $62.50 - $63.50 | Weak | Current price zone near the lower Bollinger Band and minor previous consolidation. |
| $60.25 | $59.50 - $61.00 | Strong | Major structural support aligning with the rising 200-day SMA and psychological 60 level. |
Resistance Price Levels
| Level | Range | Strength | Notes |
|---|---|---|---|
| $66.25 | $65.50 - $67.00 | Strong | Zone containing the declining 20-day and 50-day SMAs, which will likely act as dynamic resistance on any bounces. |
| $69.00 | $68.50 - $69.50 | Strong | Recent swing high (right shoulder of the topping pattern). |
| $72.00 | $71.50 - $72.50 | Strong | Recent major peak. |
Potential Chart Patterns in Formation
| Strength | Pattern | Signal | Target | Details |
|---|---|---|---|---|
| Strong | Head and Shoulders Top | Bearish | $60.00 | A topping pattern with a peak near 72 and shoulders near 69-70. Price has broken below the rough neckline area around 66. |
Frequently Asked Questions about EEM
What is the current sentiment for EEM?
The short-term sentiment for EEM is currently Bearish because Price is in a sharp short-term downtrend, trading below both the 20-day and 50-day SMAs. Momentum indicators confirm this, with a negative and expanding MACD histogram and an RSI falling towards oversold territory.. The long-term trend is classified as Bullish.
What are the key support levels for EEM?
StockDips.AI has identified key support levels for EEM at $63.00 and $60.25. These levels may represent potential accumulation zones where buying interest could emerge.
Is EEM in a significant dip or a Value Dip right now?
EEM has a Value Score of 90/100. It is currently flagged as a significant dip in the Top Dips list. It is also listed as a Value Dip because long-term sentiment is bullish.
View the full interactive analysis on StockDips.AI.