TLT Daily Technical Analysis
20+ Year Treasury Bond ETF
iShares 20+ Year Treasury Bond ETF - Invests in U.S. Treasury bonds with maturities of 20 years or more, often used for stability.
TLT Technical Analysis Summary
TLT remains entrenched in a prevailing long-term downtrend, weighed down by bearishly aligned moving averages. Short-term momentum has rotated back to the downside, threatening to test the significant swing lows near 81.50. A break below this support could signal further capitulation, while any upside rallies are likely to face stiff resistance at the 50-day and 200-day SMAs.
Included In Lists
Related Tickers of Interest
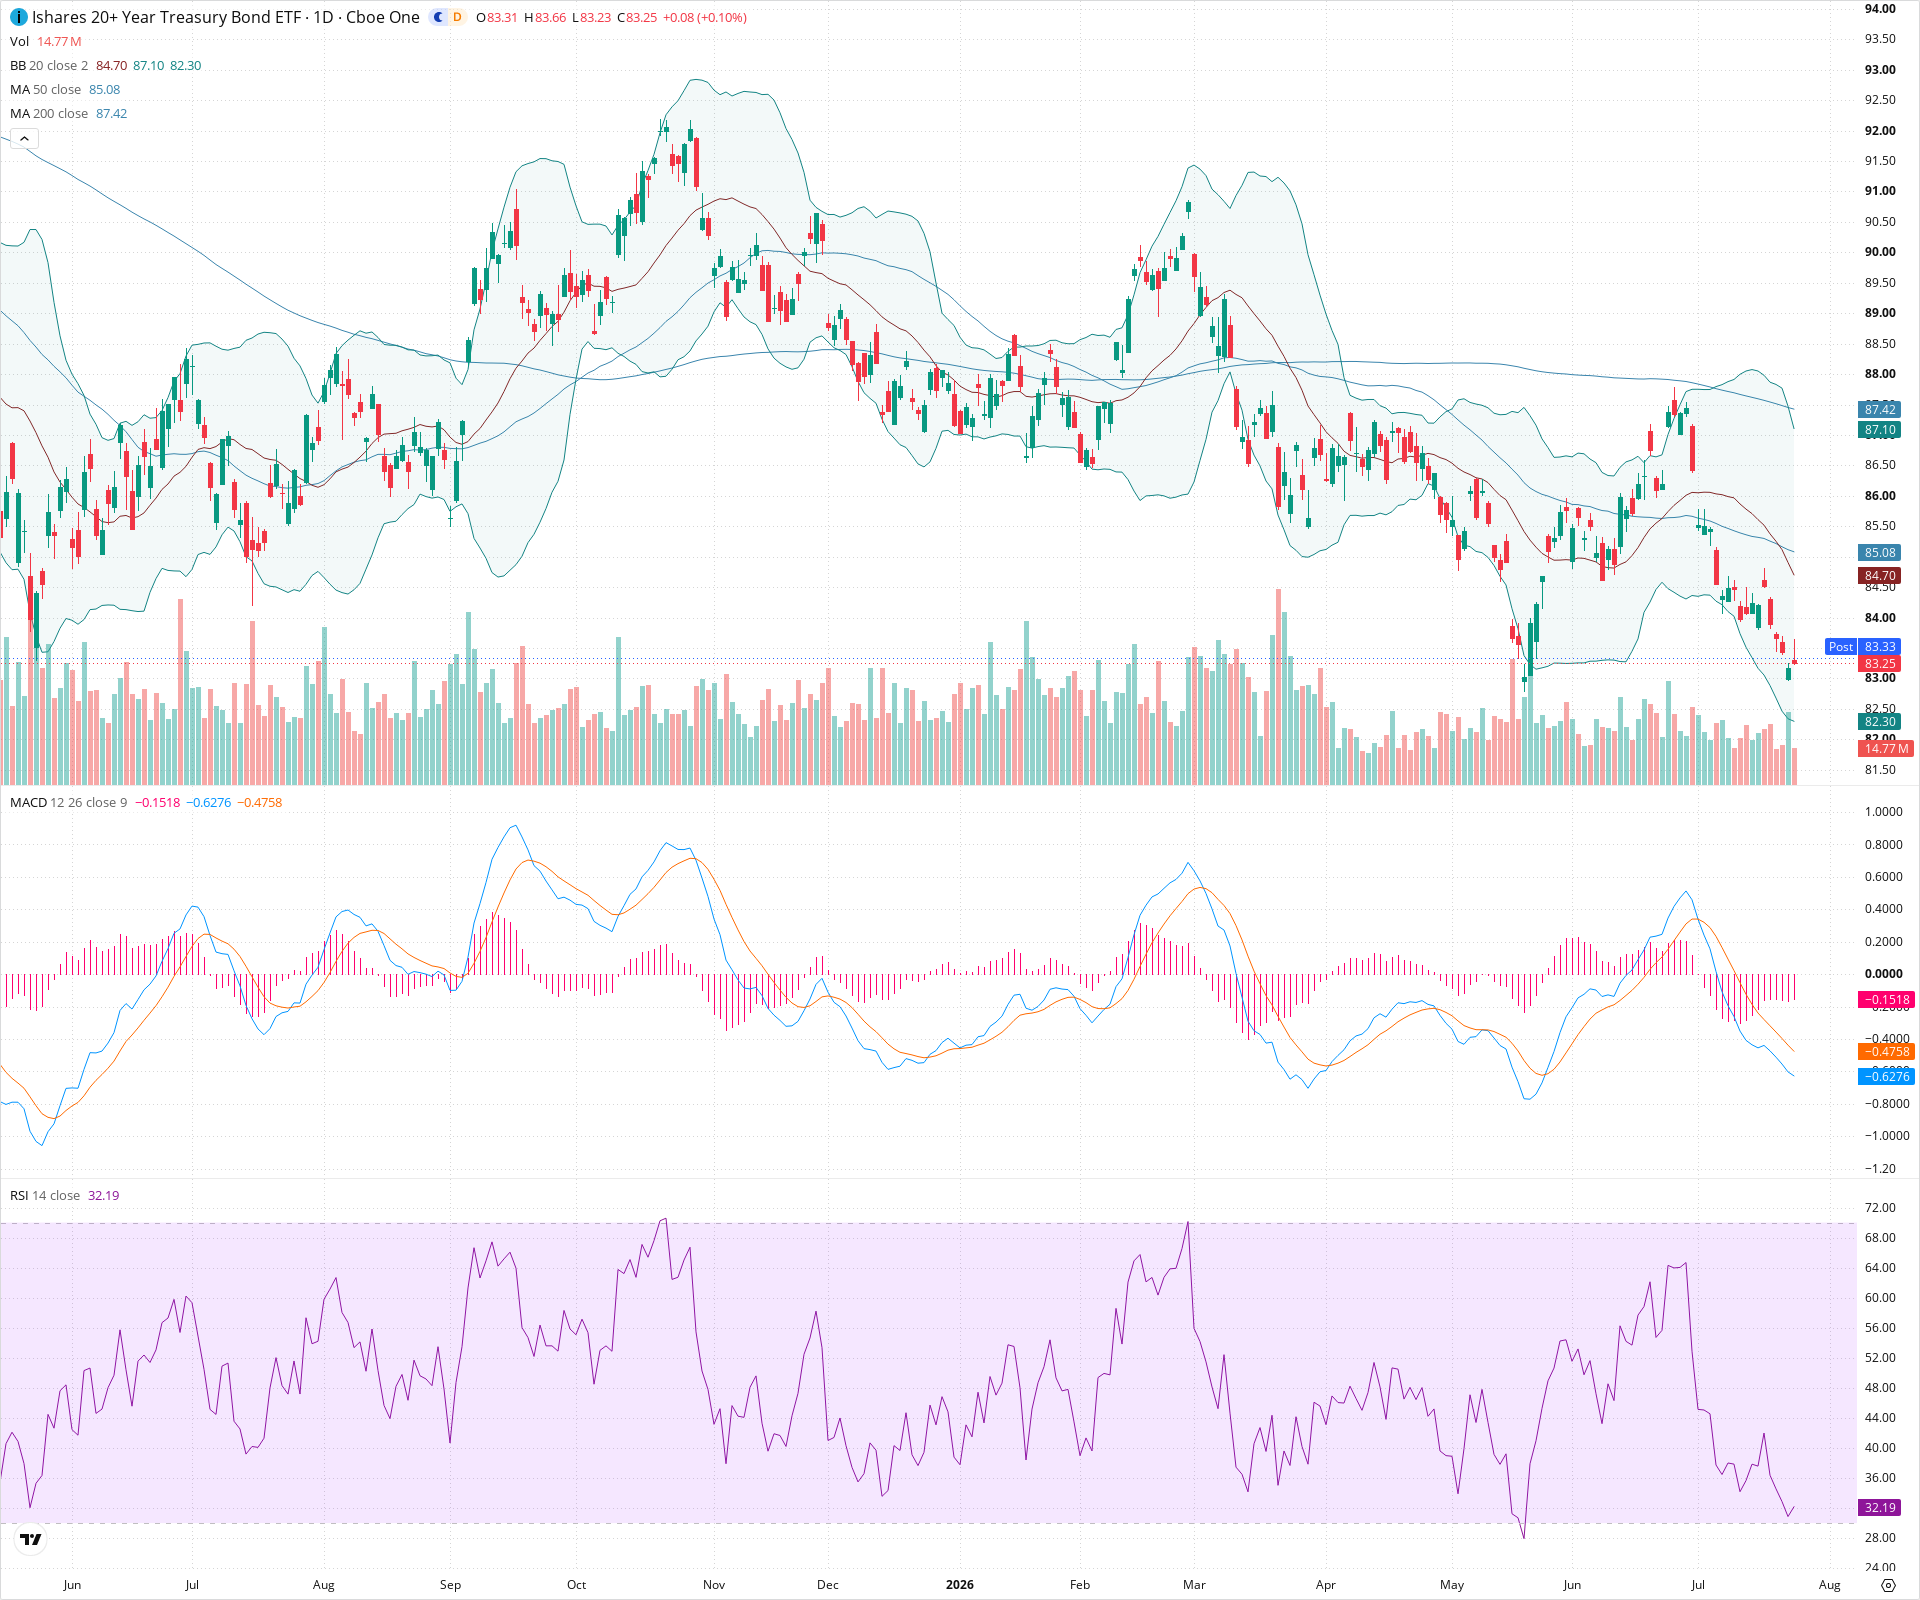
TLT Daily Chart
Sentiment
Short-term Sentiment (days to weeks): Bearish
Price has recently formed a lower high and is pushing downward, trading near the lower Bollinger Band. This is confirmed by a bearish MACD crossover with an expanding negative histogram and RSI dropping towards oversold.
Long-term Sentiment (weeks to months): Bearish
The broader trend is firmly down, characterized by price trading well below both the declining 50-day and 200-day SMAs, which are in a bearish alignment.
Report Metadata
- Timeframe: daily
- Generated at: 2026-07-24T21:03:30.177Z
- Model: gemini-3.1-pro-preview
Support Price Levels
| Level | Range | Strength | Notes |
|---|---|---|---|
| $83.25 | $83.00 - $83.50 | Weak | Current local area being tested, corresponding to minor historical consolidation. |
| $81.50 | $81.00 - $82.00 | Strong | Recent major swing low from late April/early May; a critical floor for the current structure. |
Resistance Price Levels
| Level | Range | Strength | Notes |
|---|---|---|---|
| $85.50 | $85.00 - $86.00 | Strong | Dynamic resistance area aligning closely with the descending 50-day SMA. |
| $87.75 | $87.00 - $88.50 | Strong | Recent swing high zone, also aligning with the longer-term 200-day SMA. |
Potential Chart Patterns in Formation
| Strength | Pattern | Signal | Target | Details |
|---|---|---|---|---|
| Strong | Downtrend Structure | Bearish | N/A | A continuous sequence of lower highs and lower lows over the visible chart period. |
Frequently Asked Questions about TLT
What is the current sentiment for TLT?
The short-term sentiment for TLT is currently Bearish because Price has recently formed a lower high and is pushing downward, trading near the lower Bollinger Band. This is confirmed by a bearish MACD crossover with an expanding negative histogram and RSI dropping towards oversold.. The long-term trend is classified as Bearish.
What are the key support levels for TLT?
StockDips.AI has identified key support levels for TLT at $83.25 and $81.50. These levels may represent potential accumulation zones where buying interest could emerge.
Is TLT in a significant dip or a Value Dip right now?
TLT has a Value Score of 100/100. It is not currently flagged as a significant dip in the Top Dips list. It is not listed as a Value Dip because the long-term sentiment or value-score threshold does not qualify.
View the full interactive analysis on StockDips.AI.