QQQ Daily Technical Analysis
Nasdaq-100 Index (Tech)
Invesco QQQ - Follows the Nasdaq-100 index, heavily weighted toward major technology companies.
QQQ Technical Analysis Summary
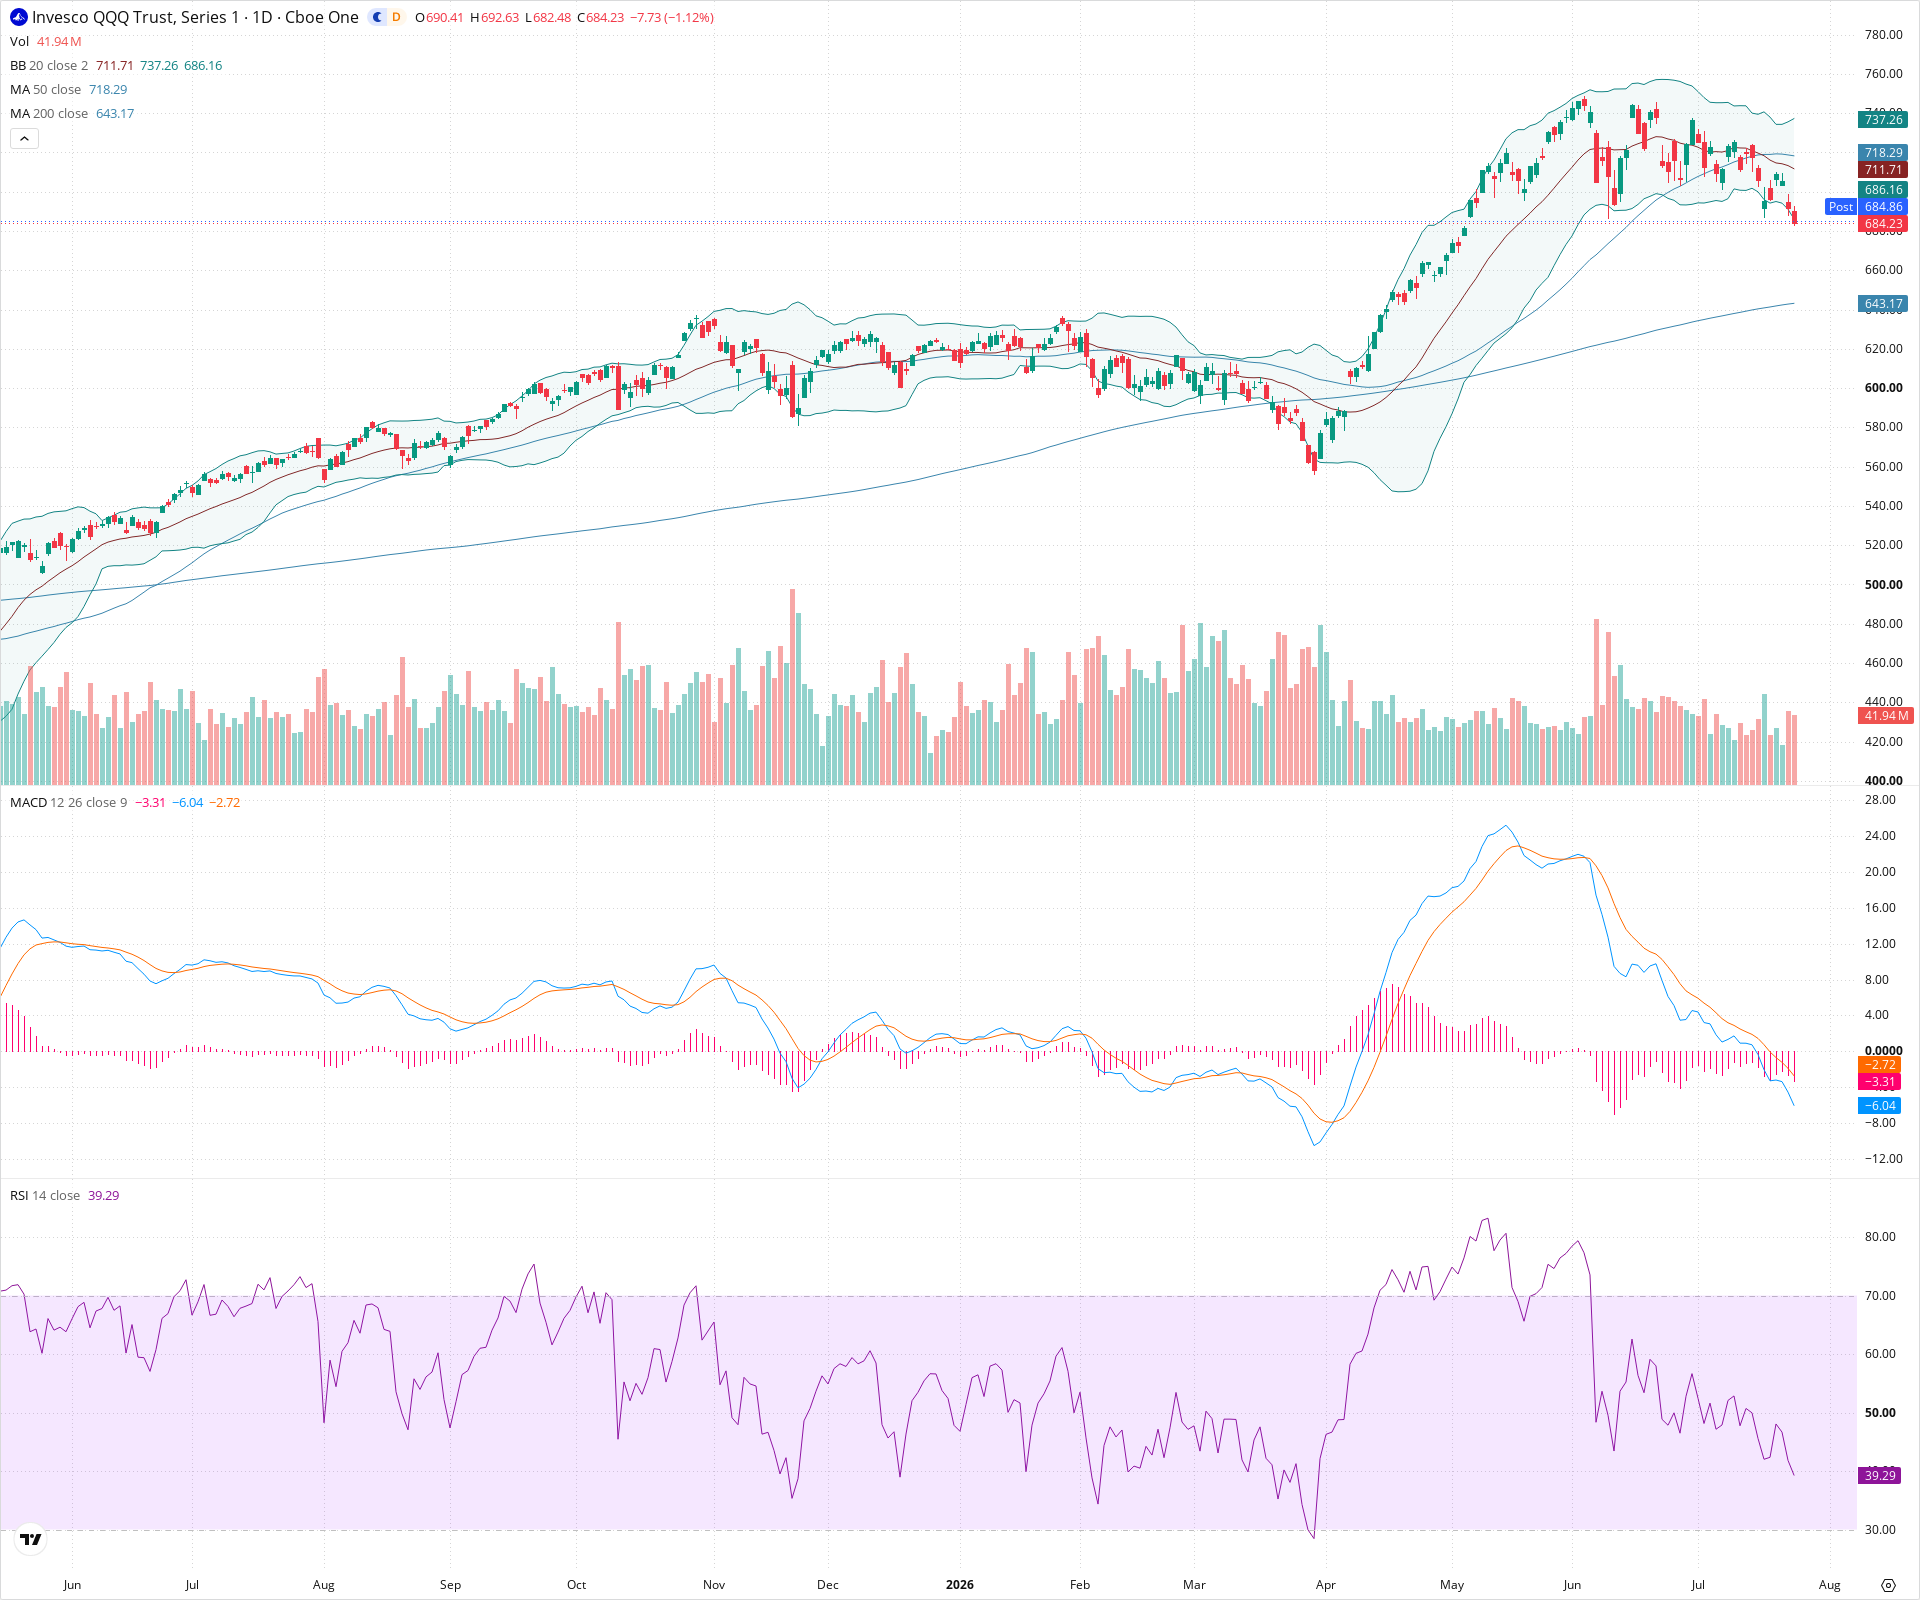
The technical picture shows a market undergoing a material short-term correction while still maintaining its long-term bullish structure. Downside momentum is currently accelerating, as evidenced by expanding negative MACD histograms and a bearish crossover of the 20 and 50-day SMAs. Long-term investors should watch the critical 640-655 support zone, anchored by the 200-day SMA, as a key area where buyers may step back in to defend the primary uptrend.
Included In Lists
Related Tickers of Interest
QQQ Daily Chart
Sentiment
Short-term Sentiment (days to weeks): Bearish
Price is trading below declining 20-day and 50-day SMAs with the 20-day having crossed below the 50-day. MACD is below the signal line with an expanding negative histogram, and RSI is falling towards oversold territory.
Long-term Sentiment (weeks to months): Bullish
Despite the current correction, the price remains well above a steadily rising 200-day SMA, maintaining the broader long-term uptrend structure.
Report Metadata
- Timeframe: daily
- Generated at: 2026-07-24T21:01:40.999Z
- Model: gemini-3.1-pro-preview
Support Price Levels
| Level | Range | Strength | Notes |
|---|---|---|---|
| $677.50 | $670.00 - $685.00 | Weak | Immediate support area near the lower Bollinger Band and minor recent consolidation zones before the latest drop. |
| $647.50 | $640.00 - $655.00 | Strong | Major structural support zone aligning with the previous significant swing low from early April and the approaching rising 200-day SMA (~643). |
Resistance Price Levels
| Level | Range | Strength | Notes |
|---|---|---|---|
| $715.00 | $710.00 - $720.00 | Strong | Overhead resistance formed by the cluster of the declining 20-day (~711) and 50-day (~718) SMAs, acting as dynamic resistance. |
| $755.00 | $745.00 - $765.00 | Strong | The major swing high zone established before the current downtrend began, representing significant structural resistance. |
Potential Chart Patterns in Formation
| Strength | Pattern | Signal | Target | Details |
|---|---|---|---|---|
| Strong | Short-term Downtrend | Bearish | N/A | Price action since the major peak has formed a distinct series of lower highs and lower lows, indicating an active corrective phase. |
| Strong | Bearish Moving Average Crossover | Bearish | N/A | The faster 20-day SMA has visibly crossed below the slower 50-day SMA, visually confirming the shift in short-to-medium term momentum to the downside. |
Frequently Asked Questions about QQQ
What is the current sentiment for QQQ?
The short-term sentiment for QQQ is currently Bearish because Price is trading below declining 20-day and 50-day SMAs with the 20-day having crossed below the 50-day. MACD is below the signal line with an expanding negative histogram, and RSI is falling towards oversold territory.. The long-term trend is classified as Bullish.
What are the key support levels for QQQ?
StockDips.AI has identified key support levels for QQQ at $677.50 and $647.50. These levels may represent potential accumulation zones where buying interest could emerge.
Is QQQ in a significant dip or a Value Dip right now?
QQQ has a Value Score of 82/100. It is currently flagged as a significant dip in the Top Dips list. It is also listed as a Value Dip because long-term sentiment is bullish.
View the full interactive analysis on StockDips.AI.