SPY Daily Technical Analysis
S&P 500 Index
SPDR S&P 500 ETF - Tracks the S&P 500 index of the largest U.S. companies and serves as a core benchmark for the U.S. market.
SPY Technical Analysis Summary
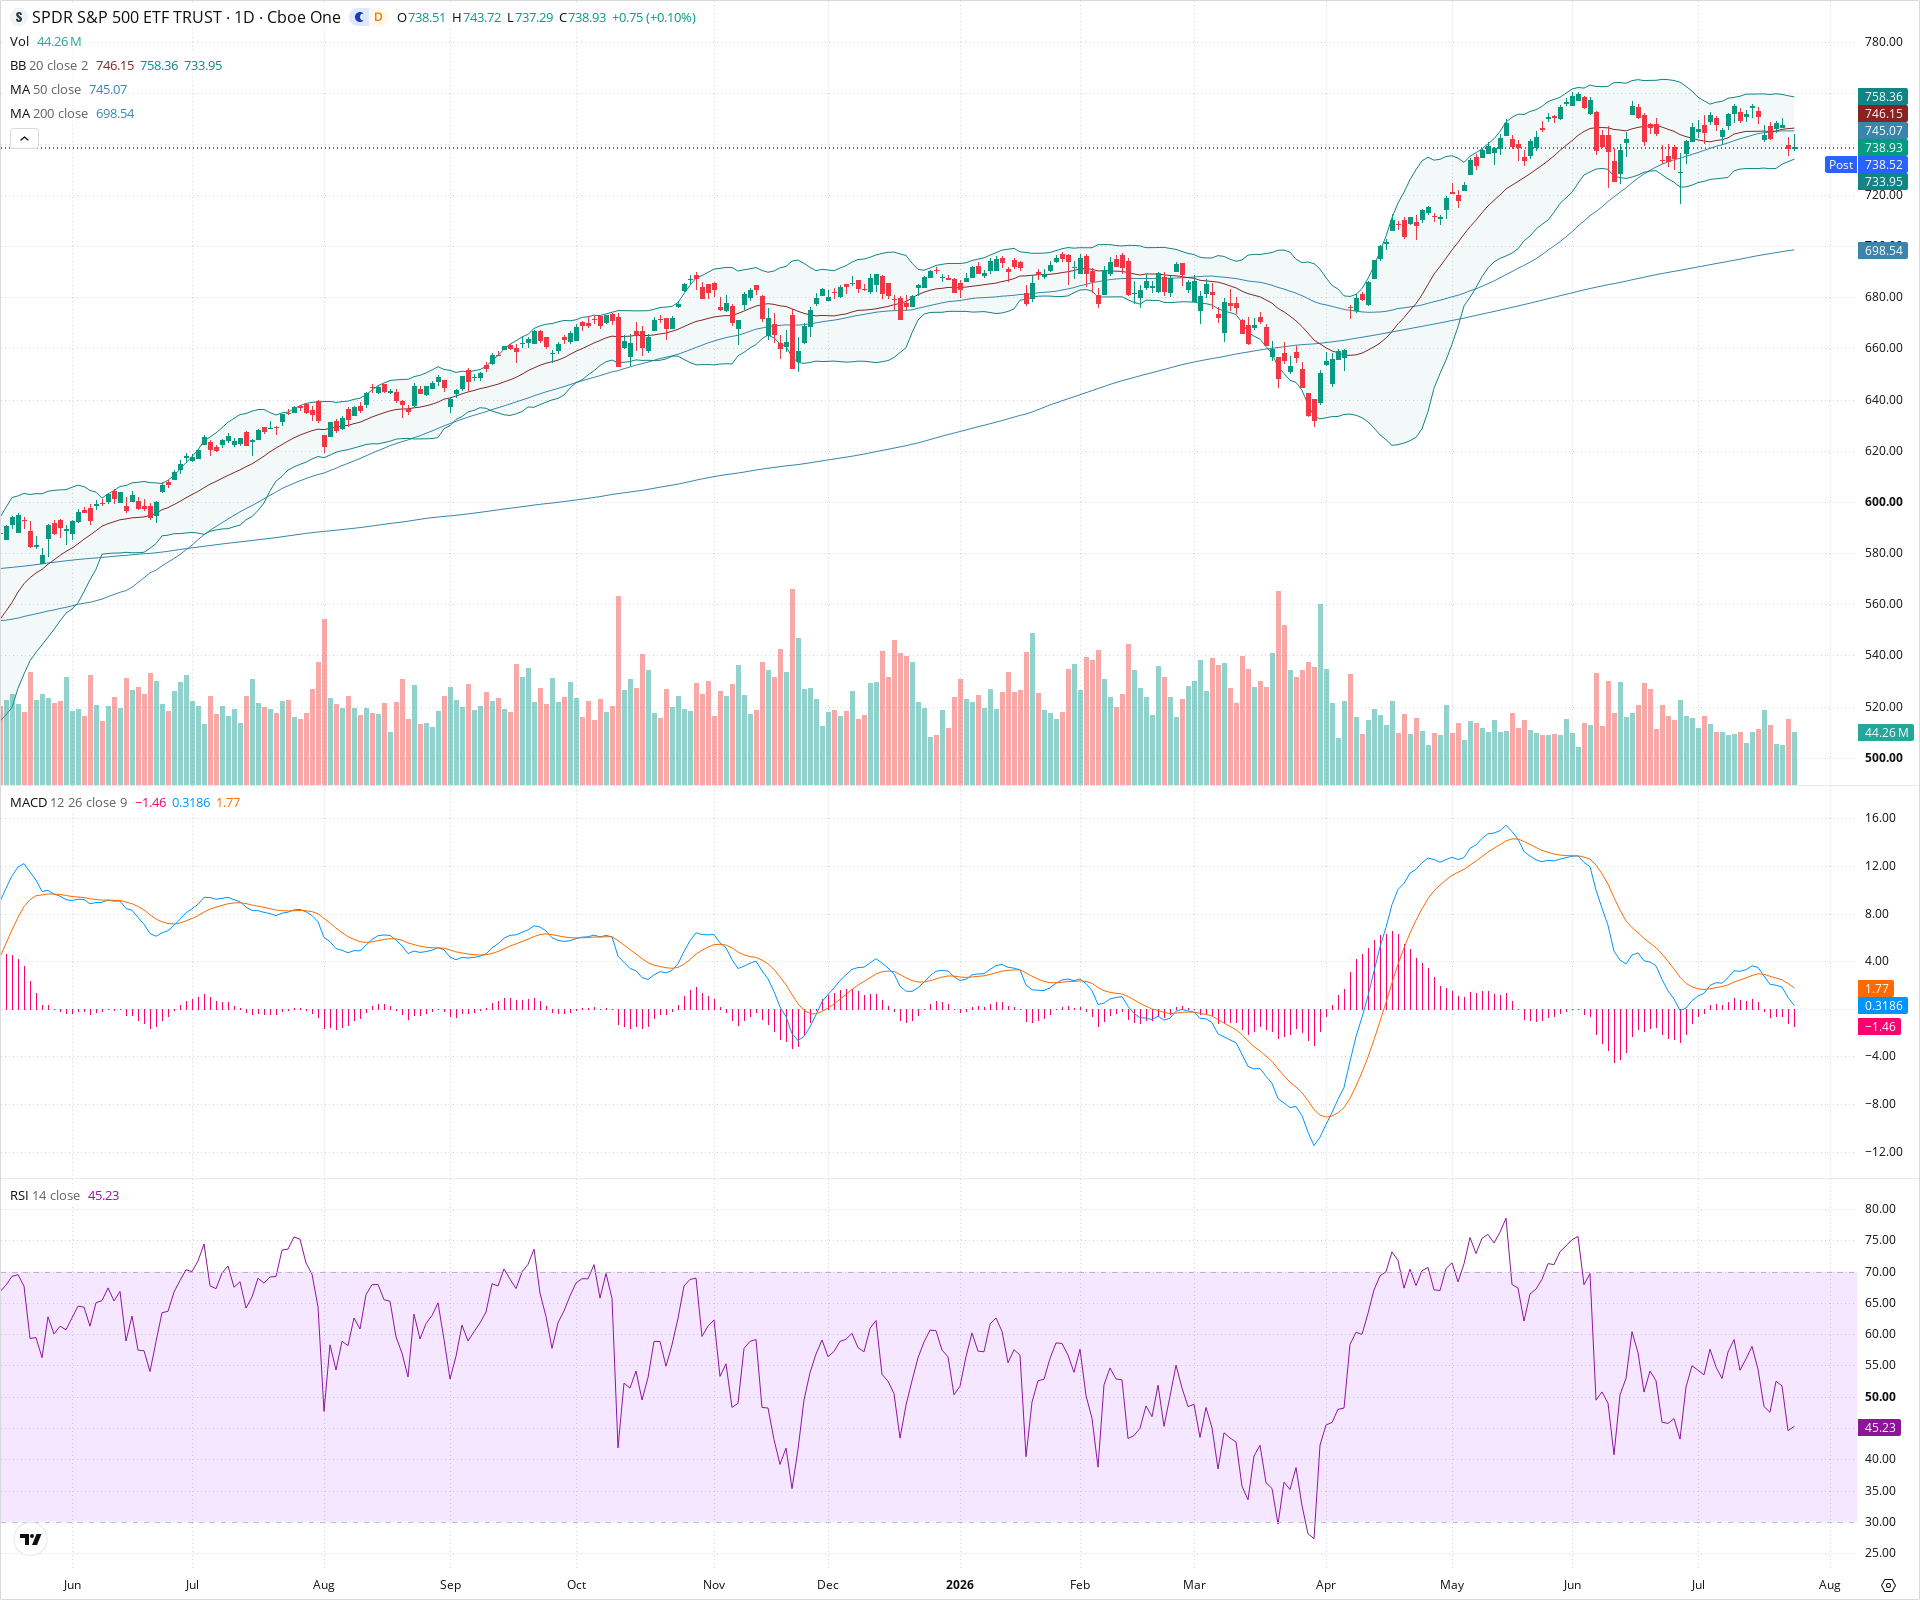
SPY remains technically sound from a long-term perspective, trending well above its rising 200-day SMA. Currently, the ETF is undergoing a healthy short-term consolidation phase, digesting previous gains below the 20 and 50-day moving averages. Investors should watch for a decisive breakout above the 750 resistance level to signal a continuation of the primary uptrend, while the 720 area serves as critical near-term support.
Included In Lists
Related Tickers of Interest
SPY Daily Chart
Sentiment
Short-term Sentiment (days to weeks): Neutral
Price is consolidating sideways after a pullback, trading below the 20 and 50 SMAs, though MACD negative momentum is decreasing and RSI is stabilizing in the mid-range.
Long-term Sentiment (weeks to months): Bullish
The price is maintaining a clear sequence of higher highs and higher lows over the broad timeframe and remains significantly above an upward-sloping 200-day SMA.
Report Metadata
- Timeframe: daily
- Generated at: 2026-07-24T21:01:35.502Z
- Model: gemini-3.1-pro-preview
Support Price Levels
| Level | Range | Strength | Notes |
|---|---|---|---|
| $722.50 | $720.00 - $725.00 | Strong | Recent swing low established in late June/early July, acting as the floor of the current consolidation. |
| $700.00 | $695.00 - $705.00 | Strong | Zone surrounding the rising 200-day SMA, representing key long-term structural support. |
Resistance Price Levels
| Level | Range | Strength | Notes |
|---|---|---|---|
| $747.50 | $745.00 - $750.00 | Strong | Immediate overhead resistance formed by the clustering of the 20-day and 50-day SMAs. |
| $768.50 | $765.00 - $772.00 | Strong | Recent prominent swing high peak established in late May/early June. |
Potential Chart Patterns in Formation
| Strength | Pattern | Signal | Target | Details |
|---|---|---|---|---|
| Strong | Consolidation Range | Neutral | N/A | Price is moving sideways in a corrective phase following a strong uptrend, contained roughly between 720 support and 750 resistance. |
Frequently Asked Questions about SPY
What is the current sentiment for SPY?
The short-term sentiment for SPY is currently Neutral because Price is consolidating sideways after a pullback, trading below the 20 and 50 SMAs, though MACD negative momentum is decreasing and RSI is stabilizing in the mid-range.. The long-term trend is classified as Bullish.
What are the key support levels for SPY?
StockDips.AI has identified key support levels for SPY at $722.50 and $700.00. These levels may represent potential accumulation zones where buying interest could emerge.
Is SPY in a significant dip or a Value Dip right now?
SPY has a Value Score of 34/100. It is not currently flagged as a significant dip in the Top Dips list. It is not listed as a Value Dip because the long-term sentiment or value-score threshold does not qualify.
View the full interactive analysis on StockDips.AI.