VXUS Daily Technical Analysis
International Stock Index
Vanguard Total International Stock ETF - Covers thousands of companies across developed and emerging markets outside the U.S.
VXUS Technical Analysis Summary
VXUS remains in a robust long-term uptrend, firmly supported by a rising 200-day moving average. In the near term, the asset is experiencing a defined technical pullback, having lost support at the 50-day moving average amid weakening momentum indicators. Long-term investors may view this current weakness as a normal corrective phase, watching for stabilization near the 82.00 support zone.
Included In Lists
Related Tickers of Interest
VXUS Daily Chart
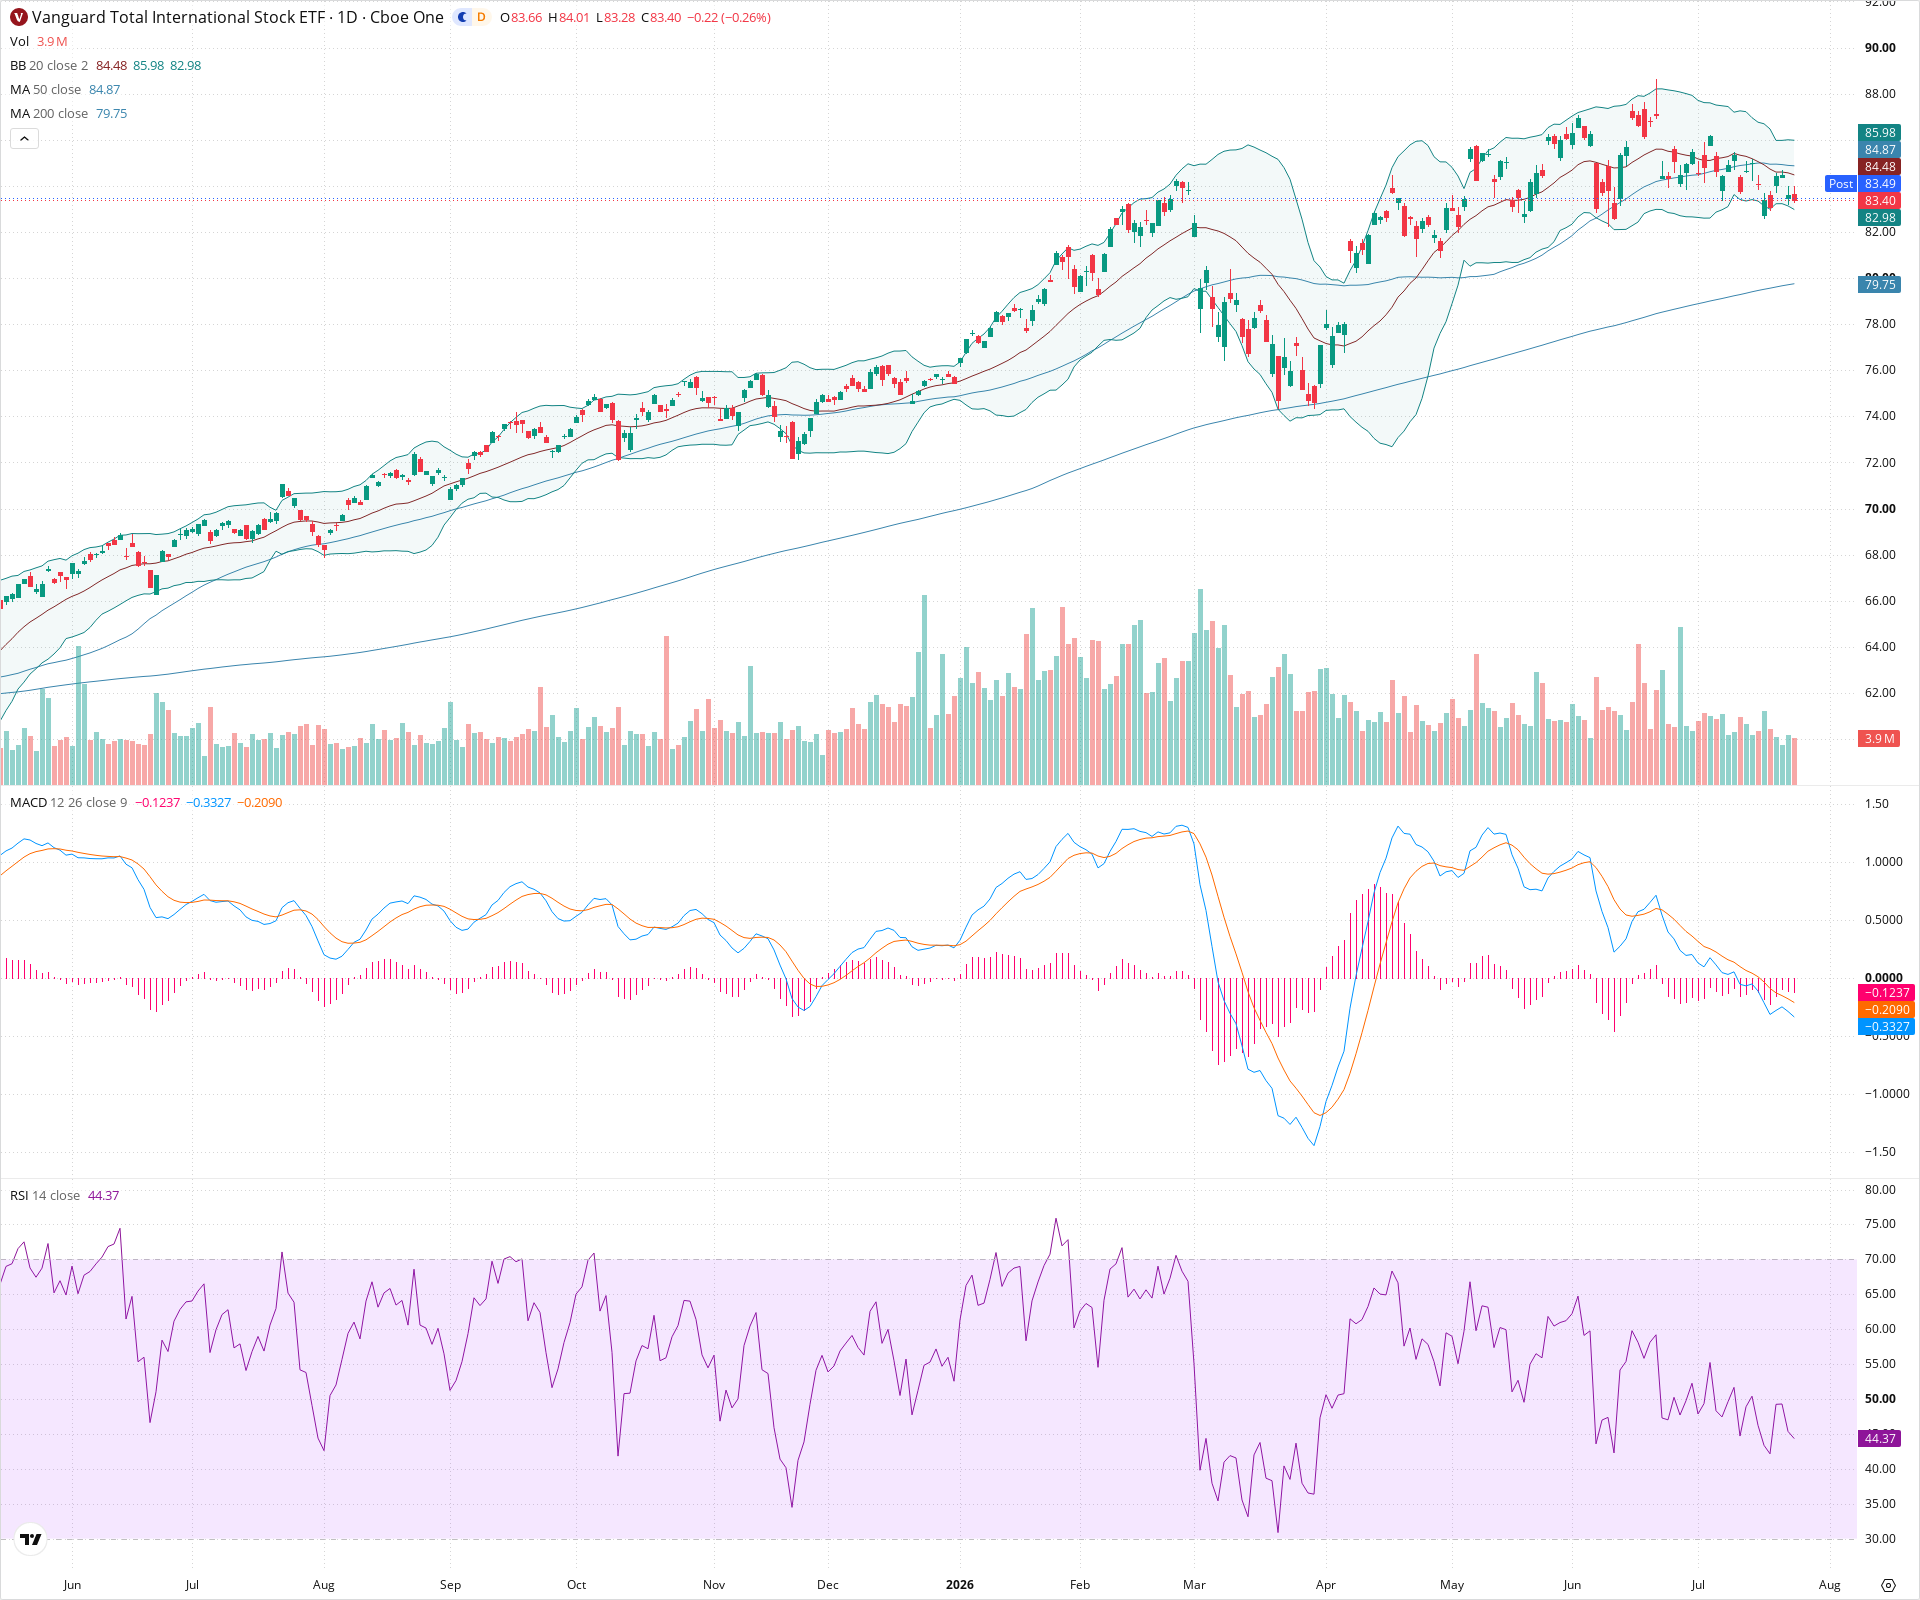
Sentiment
Short-term Sentiment (days to weeks): Bearish
Price is trading below the 50-day SMA and 20-day SMA (middle Bollinger Band). Both the MACD and RSI are trending downward, with the MACD histogram showing increasing negative momentum, indicating a short-term pullback.
Long-term Sentiment (weeks to months): Bullish
The long-term trend remains positive as the price is significantly above a steadily rising 200-day SMA, and the macro structure shows higher highs and higher lows over the chart's duration.
Report Metadata
- Timeframe: daily
- Generated at: 2026-07-24T21:01:37.899Z
- Model: gemini-3.1-pro-preview
Support Price Levels
| Level | Range | Strength | Notes |
|---|---|---|---|
| $82.25 | $82.00 - $82.50 | Strong | A previous area of resistance that flipped to support during a prior consolidation phase. |
| $79.75 | $79.50 - $80.00 | Strong | A major prior swing low which closely aligns with the current trajectory of the rising 200-day SMA. |
Resistance Price Levels
| Level | Range | Strength | Notes |
|---|---|---|---|
| $84.75 | $84.50 - $85.00 | Strong | Immediate overhead resistance zone comprising the 50-day SMA and the 20-day middle Bollinger Band. |
| $88.00 | $87.50 - $88.50 | Strong | The recent major swing high and peak before the current correction. |
Potential Chart Patterns in Formation
| Strength | Pattern | Signal | Target | Details |
|---|---|---|---|---|
| Strong | Short-term Pullback | Bearish | $82.00 | Price is undergoing a correction from recent highs, characterized by lower highs, moving below short-term moving averages, and confirmed by bearish momentum in MACD. |
Frequently Asked Questions about VXUS
What is the current sentiment for VXUS?
The short-term sentiment for VXUS is currently Bearish because Price is trading below the 50-day SMA and 20-day SMA (middle Bollinger Band). Both the MACD and RSI are trending downward, with the MACD histogram showing increasing negative momentum, indicating a short-term pullback.. The long-term trend is classified as Bullish.
What are the key support levels for VXUS?
StockDips.AI has identified key support levels for VXUS at $82.25 and $79.75. These levels may represent potential accumulation zones where buying interest could emerge.
Is VXUS in a significant dip or a Value Dip right now?
VXUS has a Value Score of 54/100. It is not currently flagged as a significant dip in the Top Dips list. It is not listed as a Value Dip because the long-term sentiment or value-score threshold does not qualify.
View the full interactive analysis on StockDips.AI.