IWM Daily Technical Analysis
US Small Cap Index (2000)
iShares Russell 2000 ETF - Tracks the index of 2000 small U.S. companies representing the small-cap segment.
IWM Technical Analysis Summary
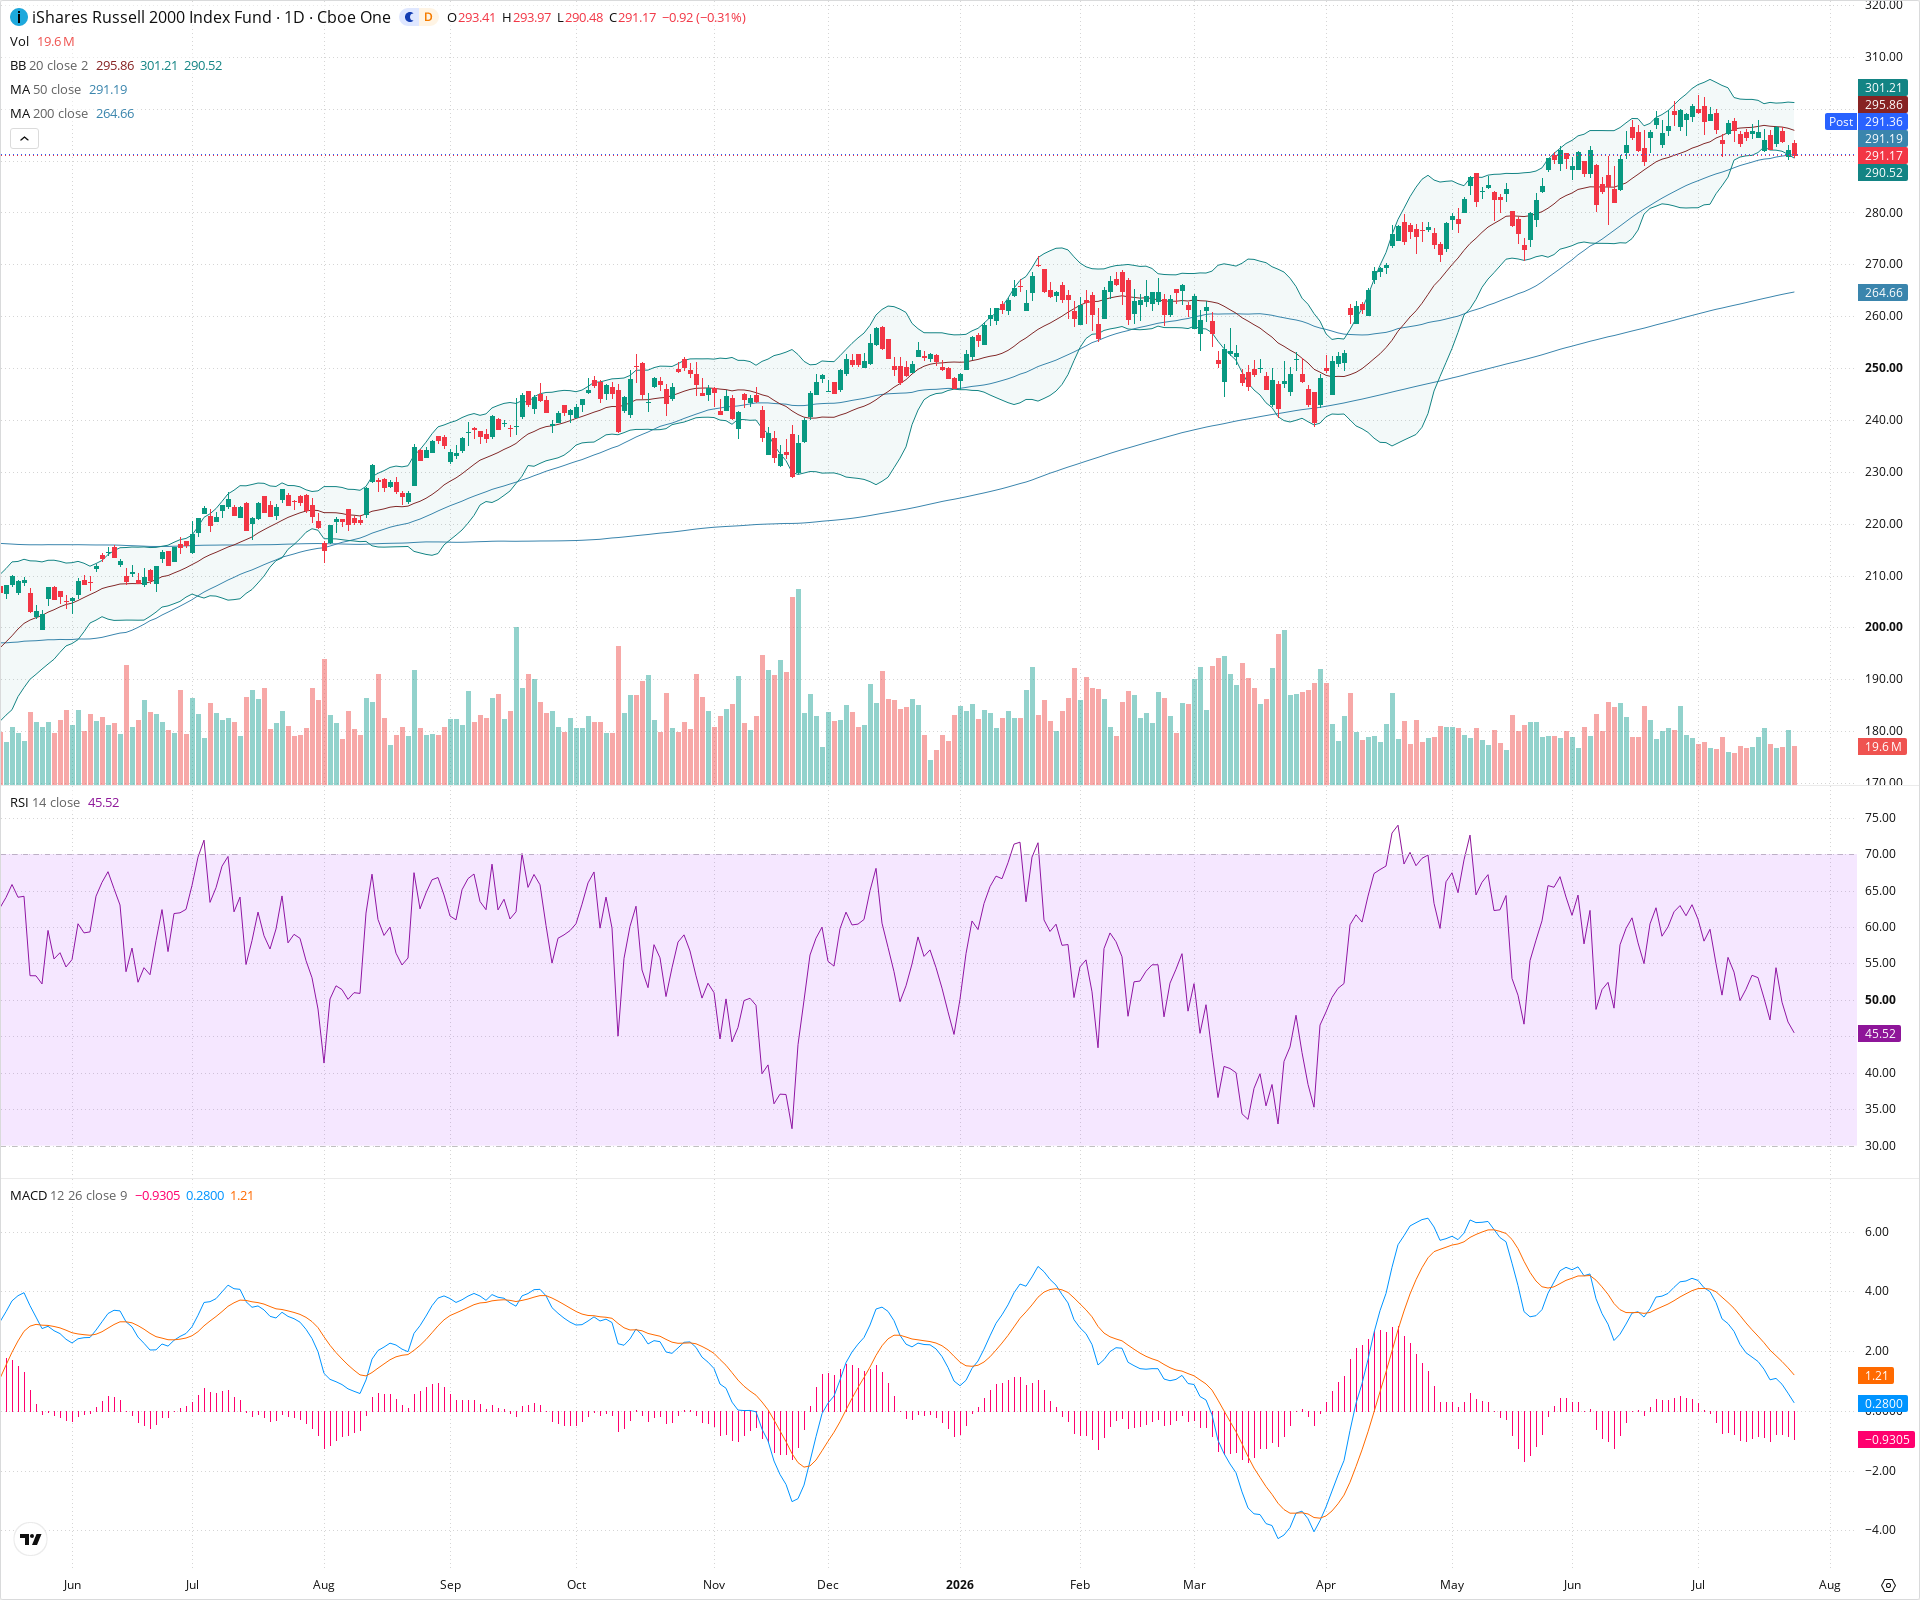
IWM exhibits a strong long-term bullish structure, evidenced by its position above rising 50-day and 200-day moving averages. However, short-term momentum has distinctly shifted bearish following a rejection near 310, confirmed by falling RSI and a negative MACD crossover. The immediate technical focus is whether the current pullback can find support at the 50-day SMA (~291), or if a deeper correction toward the 280 structural support zone is necessary.
Included In Lists
Related Tickers of Interest
IWM Daily Chart
Sentiment
Short-term Sentiment (days to weeks): Bearish
Price has fallen below the 20-day SMA, RSI has dropped below the 50 midline, and MACD shows a bearish crossover with an expanding negative histogram.
Long-term Sentiment (weeks to months): Bullish
The overarching trend remains positive as price is trading above a clearly rising 200-day SMA, and the 50-day SMA is also trending upwards above the 200-day.
Report Metadata
- Timeframe: daily
- Generated at: 2026-07-24T21:02:30.300Z
- Model: gemini-3.1-pro-preview
Support Price Levels
| Level | Range | Strength | Notes |
|---|---|---|---|
| $291.00 | $290.00 - $292.00 | Weak | Immediate test of the rising 50-day SMA. |
| $277.50 | $275.00 - $280.00 | Strong | Previous significant consolidation zone and swing low prior to the recent leg up. |
| $265.00 | $264.00 - $266.00 | Strong | Major dynamic support at the rising 200-day SMA. |
Resistance Price Levels
| Level | Range | Strength | Notes |
|---|---|---|---|
| $296.00 | $295.00 - $297.00 | Weak | The 20-day SMA level, which recently broke as support and may act as initial resistance. |
| $307.50 | $305.00 - $310.00 | Strong | Recent all-time high zone where significant selling pressure emerged. |
Potential Chart Patterns in Formation
| Strength | Pattern | Signal | Target | Details |
|---|---|---|---|---|
| Moderate | Pullback to 50 SMA | Neutral | N/A | The asset is experiencing a short-term correction within a broader uptrend, currently testing the 50-day moving average. |
Frequently Asked Questions about IWM
What is the current sentiment for IWM?
The short-term sentiment for IWM is currently Bearish because Price has fallen below the 20-day SMA, RSI has dropped below the 50 midline, and MACD shows a bearish crossover with an expanding negative histogram.. The long-term trend is classified as Bullish.
What are the key support levels for IWM?
StockDips.AI has identified key support levels for IWM at $291.00 and $277.50. These levels may represent potential accumulation zones where buying interest could emerge.
Is IWM in a significant dip or a Value Dip right now?
IWM has a Value Score of 97/100. It is currently flagged as a significant dip in the Top Dips list. It is also listed as a Value Dip because long-term sentiment is bullish.
View the full interactive analysis on StockDips.AI.