MRVL Weekly Technical Analysis
Marvell Technology Inc
Designs semiconductors for networking, storage, and 5G infrastructure.
MRVL Technical Analysis Summary
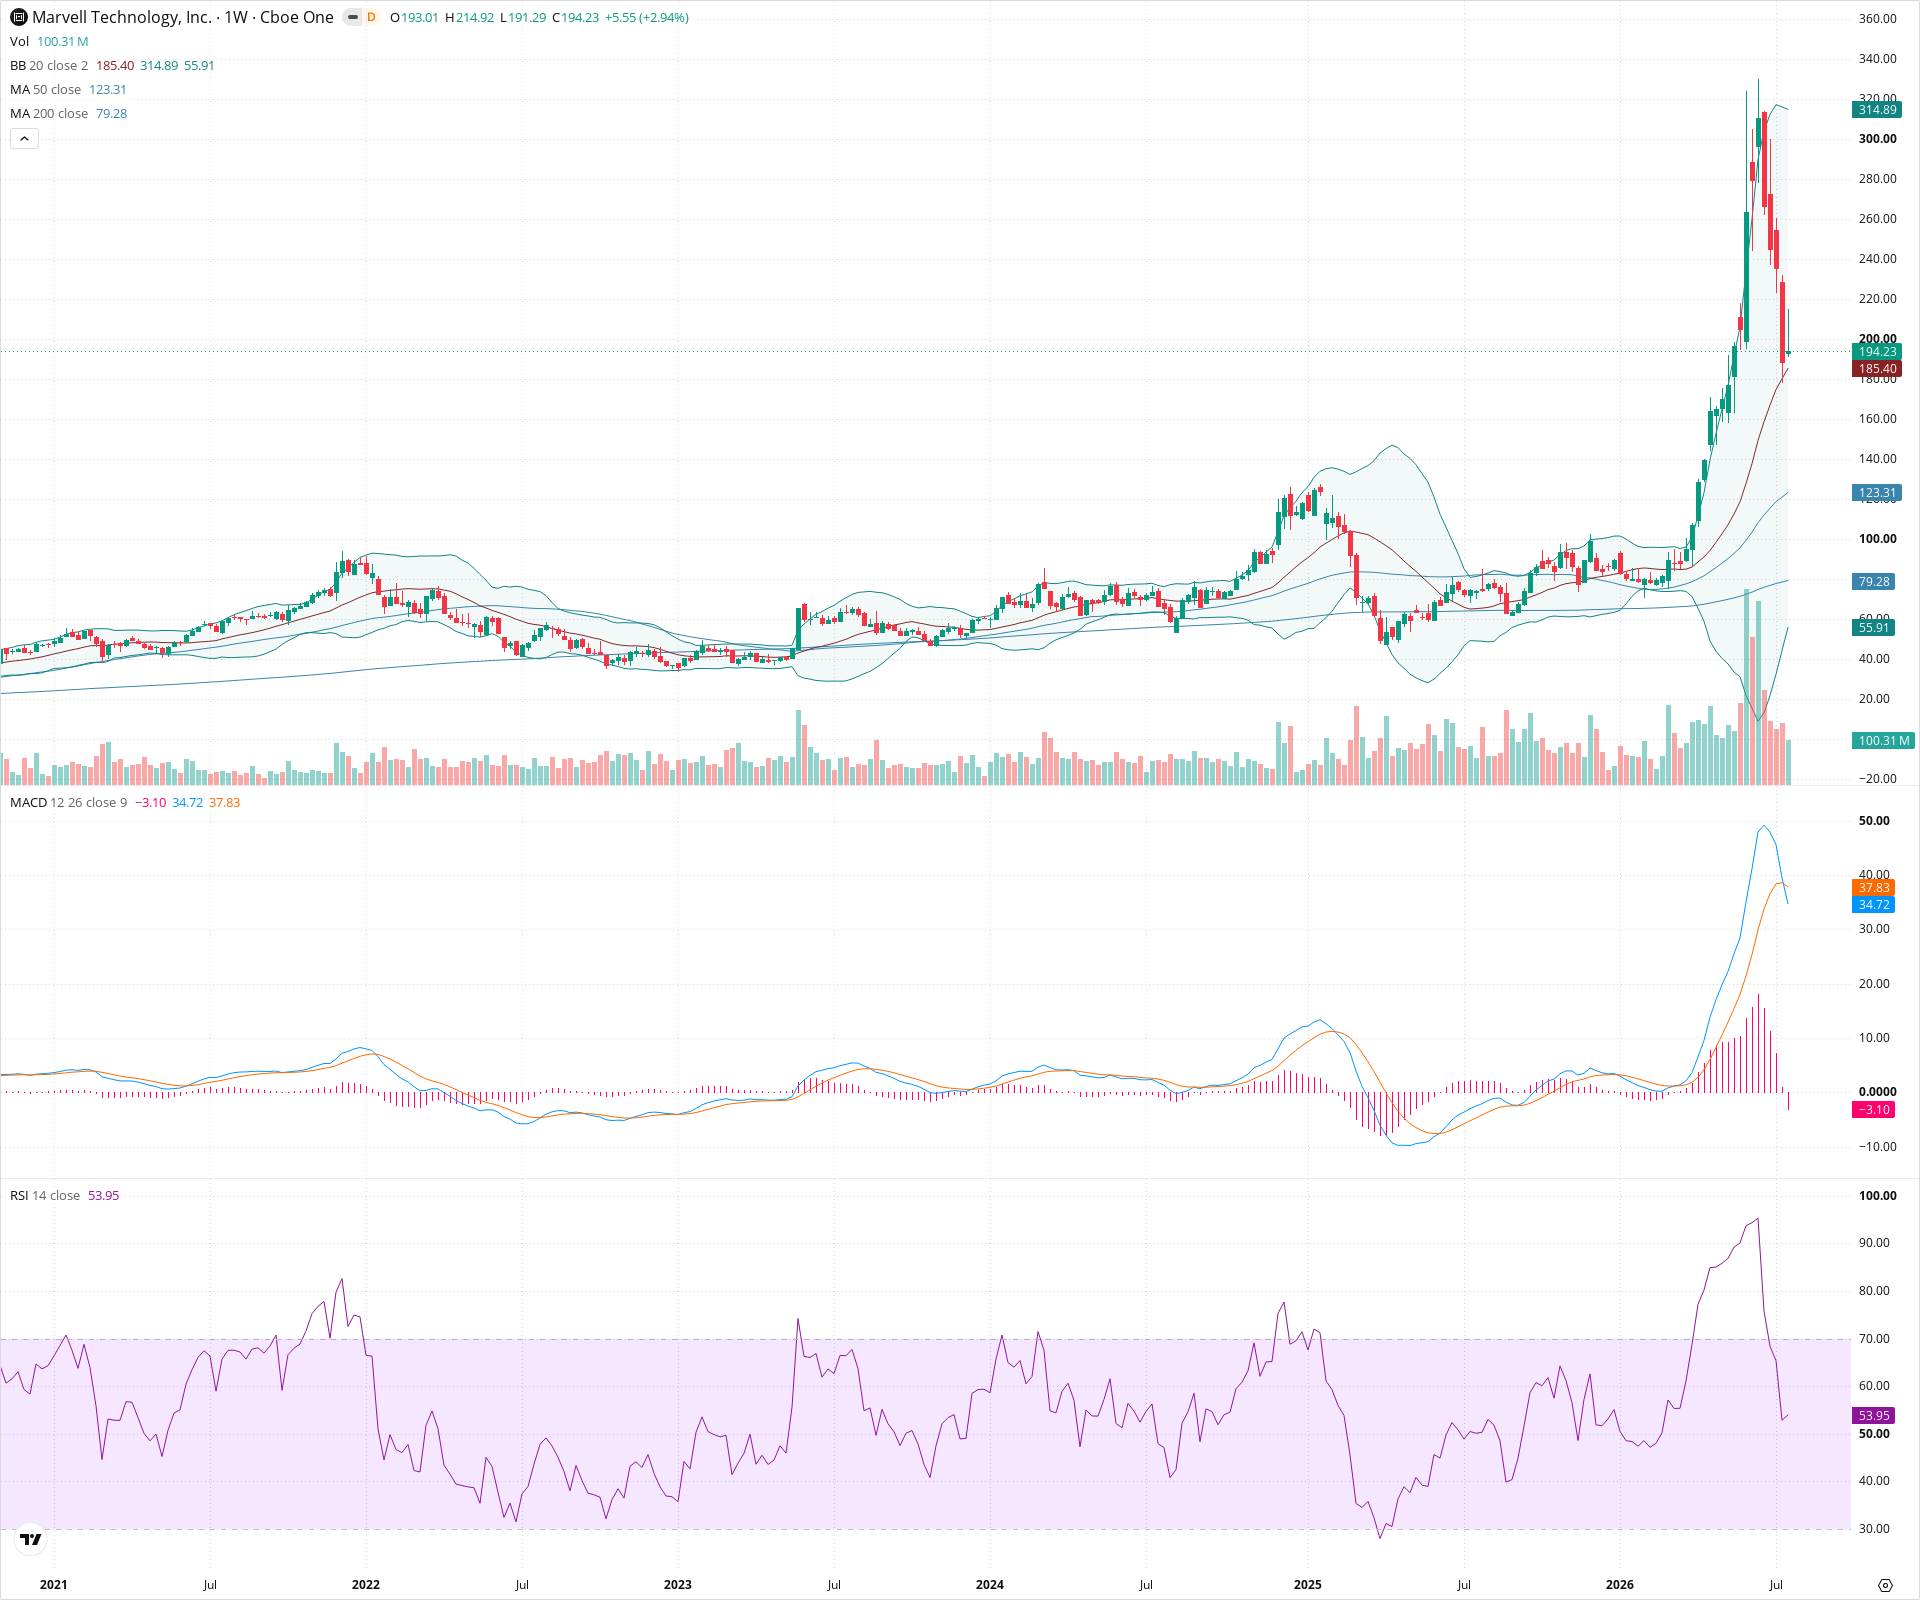
MRVL is in a dominant long-term uptrend but is currently undergoing a severe mean-reversion correction following a parabolic blow-off top. Short-term momentum is decisively negative as the stock attempts to find a floor, with immediate focus on holding the 20-week SMA. The long-term technical picture remains constructive as long as price eventually bases above the 50-week SMA.
Included In Lists
Related Tickers of Interest
MRVL Weekly Chart
Sentiment
Short-term Sentiment (days to weeks): Bearish
The price is experiencing a sharp, high-volume pullback from recent highs, accompanied by an expanding negative MACD histogram, indicating strong near-term downward momentum.
Long-term Sentiment (weeks to months): Bullish
The broader macro trend remains firmly up, with the price positioned significantly above both the rising 50-week and 200-week SMAs.
Report Metadata
- Timeframe: weekly
- Generated at: 2026-07-25T09:06:37.198Z
- Model: gemini-3.1-pro-preview
Support Price Levels
| Level | Range | Strength | Notes |
|---|---|---|---|
| $185.00 | $180.00 - $190.00 | Weak | Immediate support zone near the rising 20-week SMA and recent candlestick lows. |
| $130.00 | $120.00 - $140.00 | Strong | Major prior consolidation zone and confluence with the rising 50-week SMA. |
Resistance Price Levels
| Level | Range | Strength | Notes |
|---|---|---|---|
| $250.00 | $240.00 - $260.00 | Weak | Intermediate structural resistance established during the recent sharp decline. |
| $310.00 | $300.00 - $320.00 | Strong | The recent extreme peak, representing a major supply zone. |
Potential Chart Patterns in Formation
| Strength | Pattern | Signal | Target | Details |
|---|---|---|---|---|
| Strong | Parabolic Blow-off Top | Bearish | N/A | An extreme, near-vertical price advance followed by a rapid, high-volume reversal, indicating exhaustion and a phase of mean reversion. |
Frequently Asked Questions about MRVL
What is the current sentiment for MRVL?
The short-term sentiment for MRVL is currently Bearish because The price is experiencing a sharp, high-volume pullback from recent highs, accompanied by an expanding negative MACD histogram, indicating strong near-term downward momentum.. The long-term trend is classified as Bullish.
What are the key support levels for MRVL?
StockDips.AI has identified key support levels for MRVL at $185.00 and $130.00. These levels may represent potential accumulation zones where buying interest could emerge.
Is MRVL in a significant dip or a Value Dip right now?
MRVL has a Value Score of 65/100. It is not currently flagged as a significant dip in the Top Dips list. It is not listed as a Value Dip because the long-term sentiment or value-score threshold does not qualify.
View the full interactive analysis on StockDips.AI.