PEP Weekly Technical Analysis
PepsiCo
Global food & beverage giant (Pepsi, Gatorade, Lays, Doritos)
PEP Technical Analysis Summary
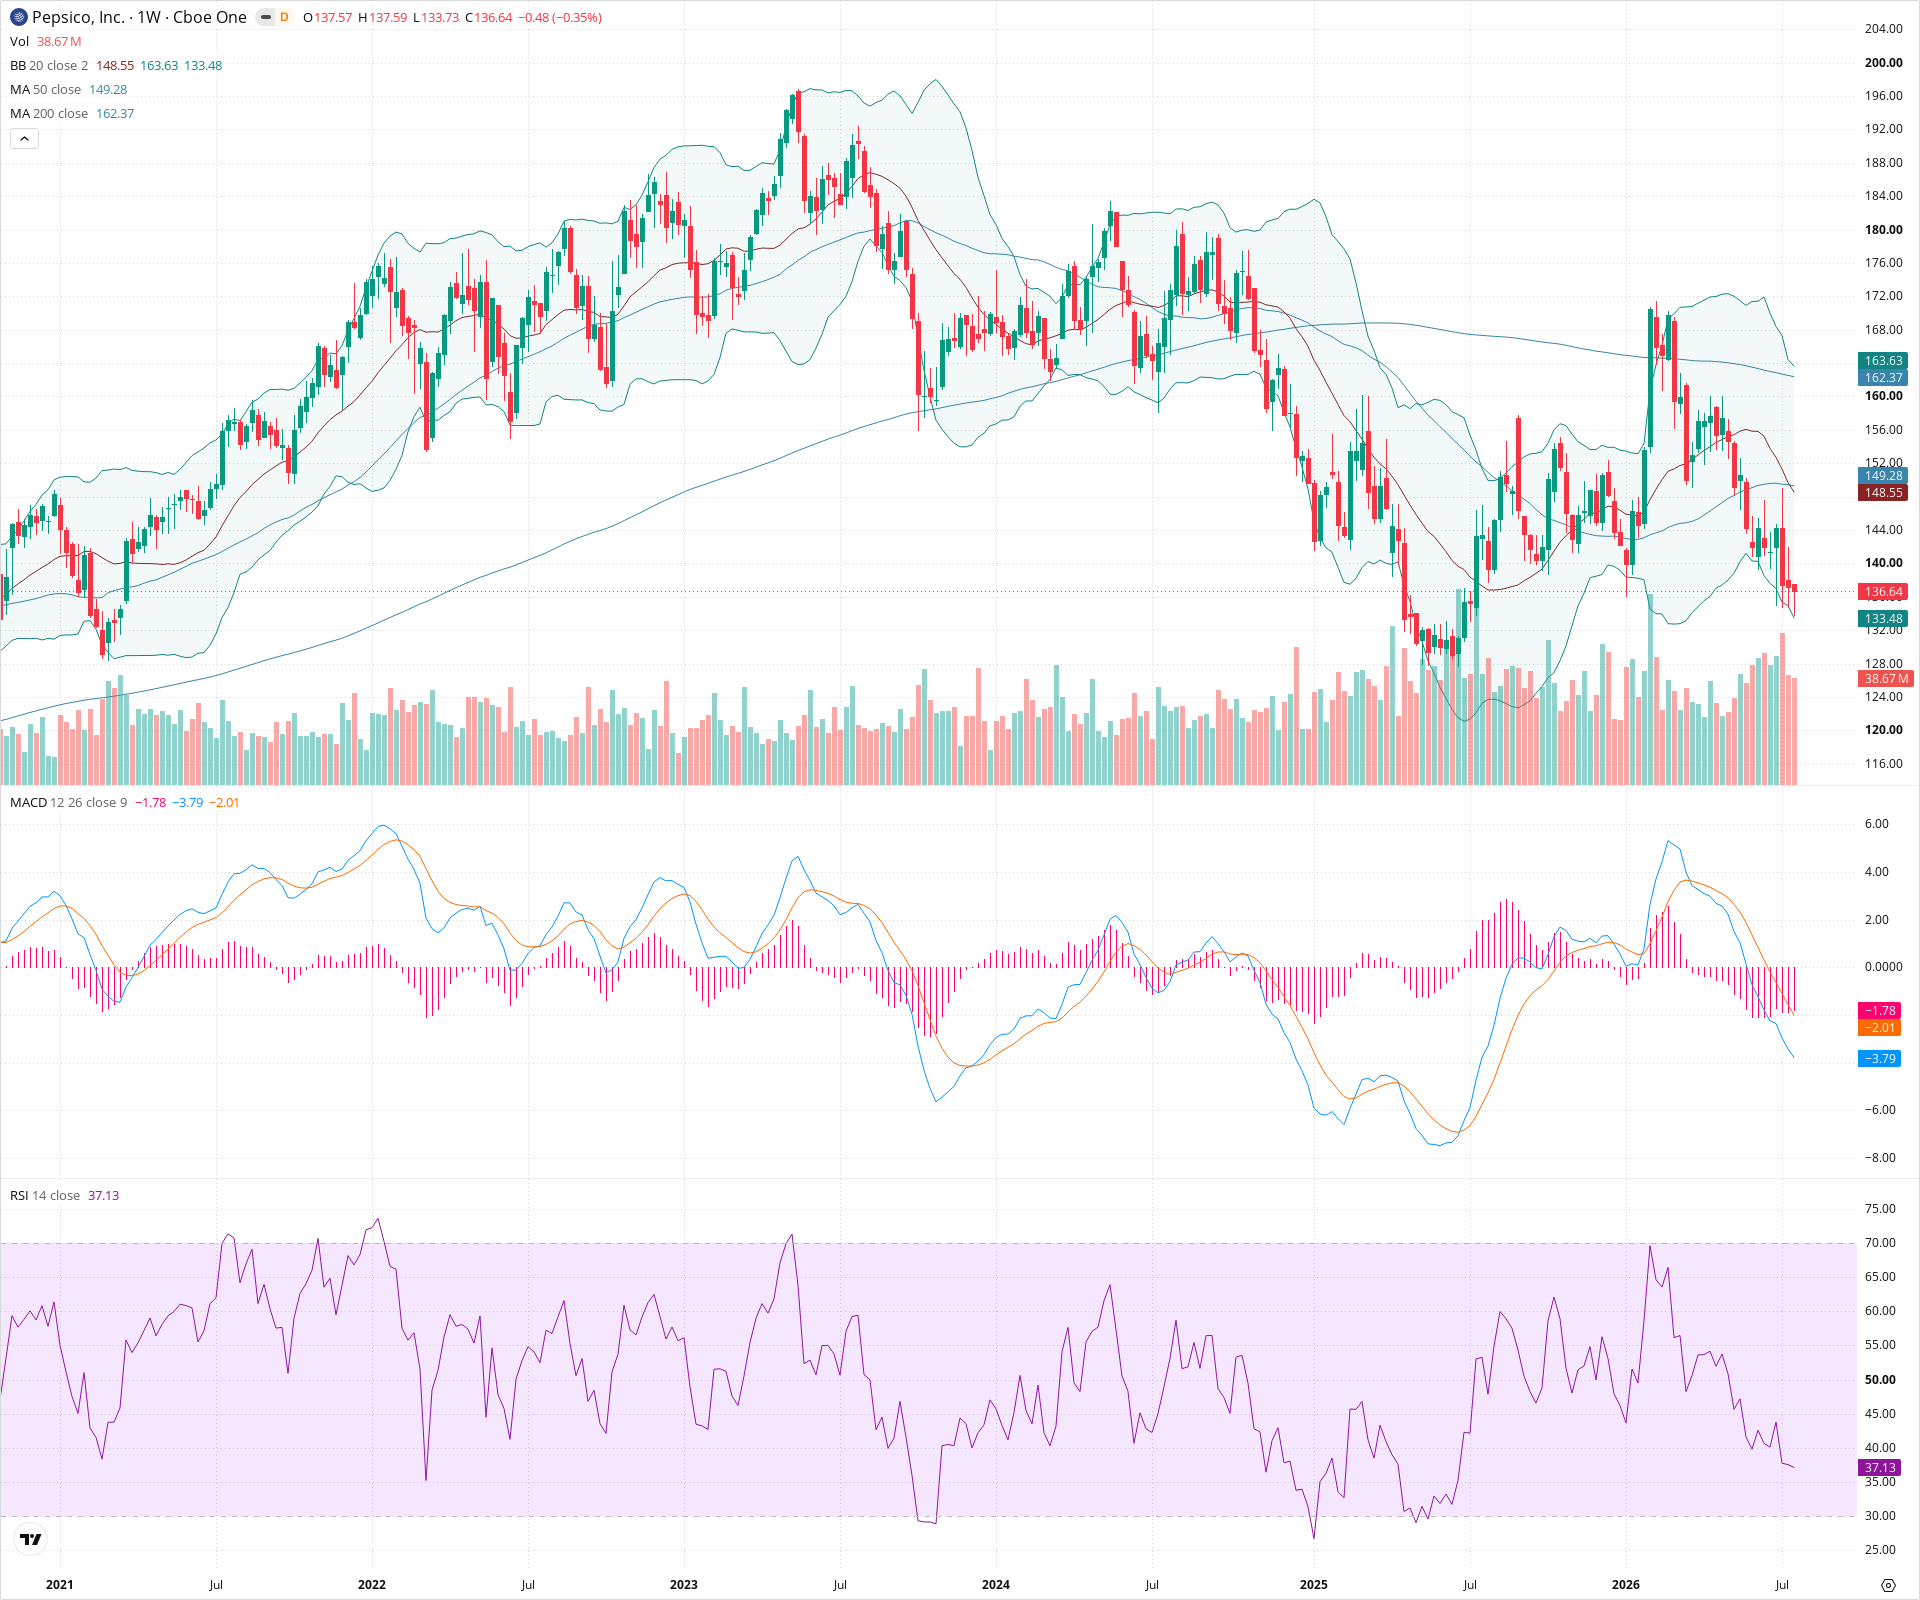
The weekly chart for PEP illustrates a pronounced and sustained downtrend, with the price action firmly below key moving averages including the 50-week and 200-week SMAs. Short-term momentum remains bearish, as evidenced by expanding negative MACD and price riding the lower Bollinger Band. The stock is approaching a critical long-term support zone around 128-130; a break below this level could signal further significant downside, while any recovery rally will face stiff resistance near the 148-150 area.
Included In Lists
Related Tickers of Interest
PEP Weekly Chart
Sentiment
Short-term Sentiment (days to weeks): Bearish
Price is making lower lows, trading below the 20-week and 50-week SMAs, and riding the lower Bollinger Band. The MACD histogram is negative and widening, confirming strong downward momentum.
Long-term Sentiment (weeks to months): Bearish
The stock is in a clear long-term downtrend, trading significantly below a declining 200-week SMA. The 50-week SMA is also below the 200-week SMA, indicating a sustained bearish regime.
Report Metadata
- Timeframe: weekly
- Generated at: 2026-07-25T09:04:45.699Z
- Model: gemini-3.1-pro-preview
Support Price Levels
| Level | Range | Strength | Notes |
|---|---|---|---|
| $133.00 | $132.00 - $134.00 | Weak | Near-term minor swing lows. |
| $129.50 | $128.00 - $131.00 | Strong | Major structural swing low from previous years. A critical line in the sand for long-term bulls. |
Resistance Price Levels
| Level | Range | Strength | Notes |
|---|---|---|---|
| $148.50 | $147.00 - $150.00 | Strong | Confluence of recent structural resistance and the declining 20-week and 50-week SMAs. |
| $162.00 | $160.00 - $164.00 | Strong | Major overhead resistance zone coinciding with the 200-week SMA. |
Potential Chart Patterns in Formation
| Strength | Pattern | Signal | Target | Details |
|---|---|---|---|---|
| Strong | Downtrend / Lower Highs and Lower Lows | Bearish | N/A | Price action has consistently formed a sequence of lower highs and lower lows over the past year, confirming a bearish trend. |
Frequently Asked Questions about PEP
What is the current sentiment for PEP?
The short-term sentiment for PEP is currently Bearish because Price is making lower lows, trading below the 20-week and 50-week SMAs, and riding the lower Bollinger Band. The MACD histogram is negative and widening, confirming strong downward momentum.. The long-term trend is classified as Bearish.
What are the key support levels for PEP?
StockDips.AI has identified key support levels for PEP at $133.00 and $129.50. These levels may represent potential accumulation zones where buying interest could emerge.
Is PEP in a significant dip or a Value Dip right now?
PEP has a Value Score of 65/100. It is not currently flagged as a significant dip in the Top Dips list. It is not listed as a Value Dip because the long-term sentiment or value-score threshold does not qualify.
View the full interactive analysis on StockDips.AI.