PG Weekly Technical Analysis
Procter & Gamble
Consumer staples leader (Tide, Pampers, Gillette, Olay)
PG Technical Analysis Summary
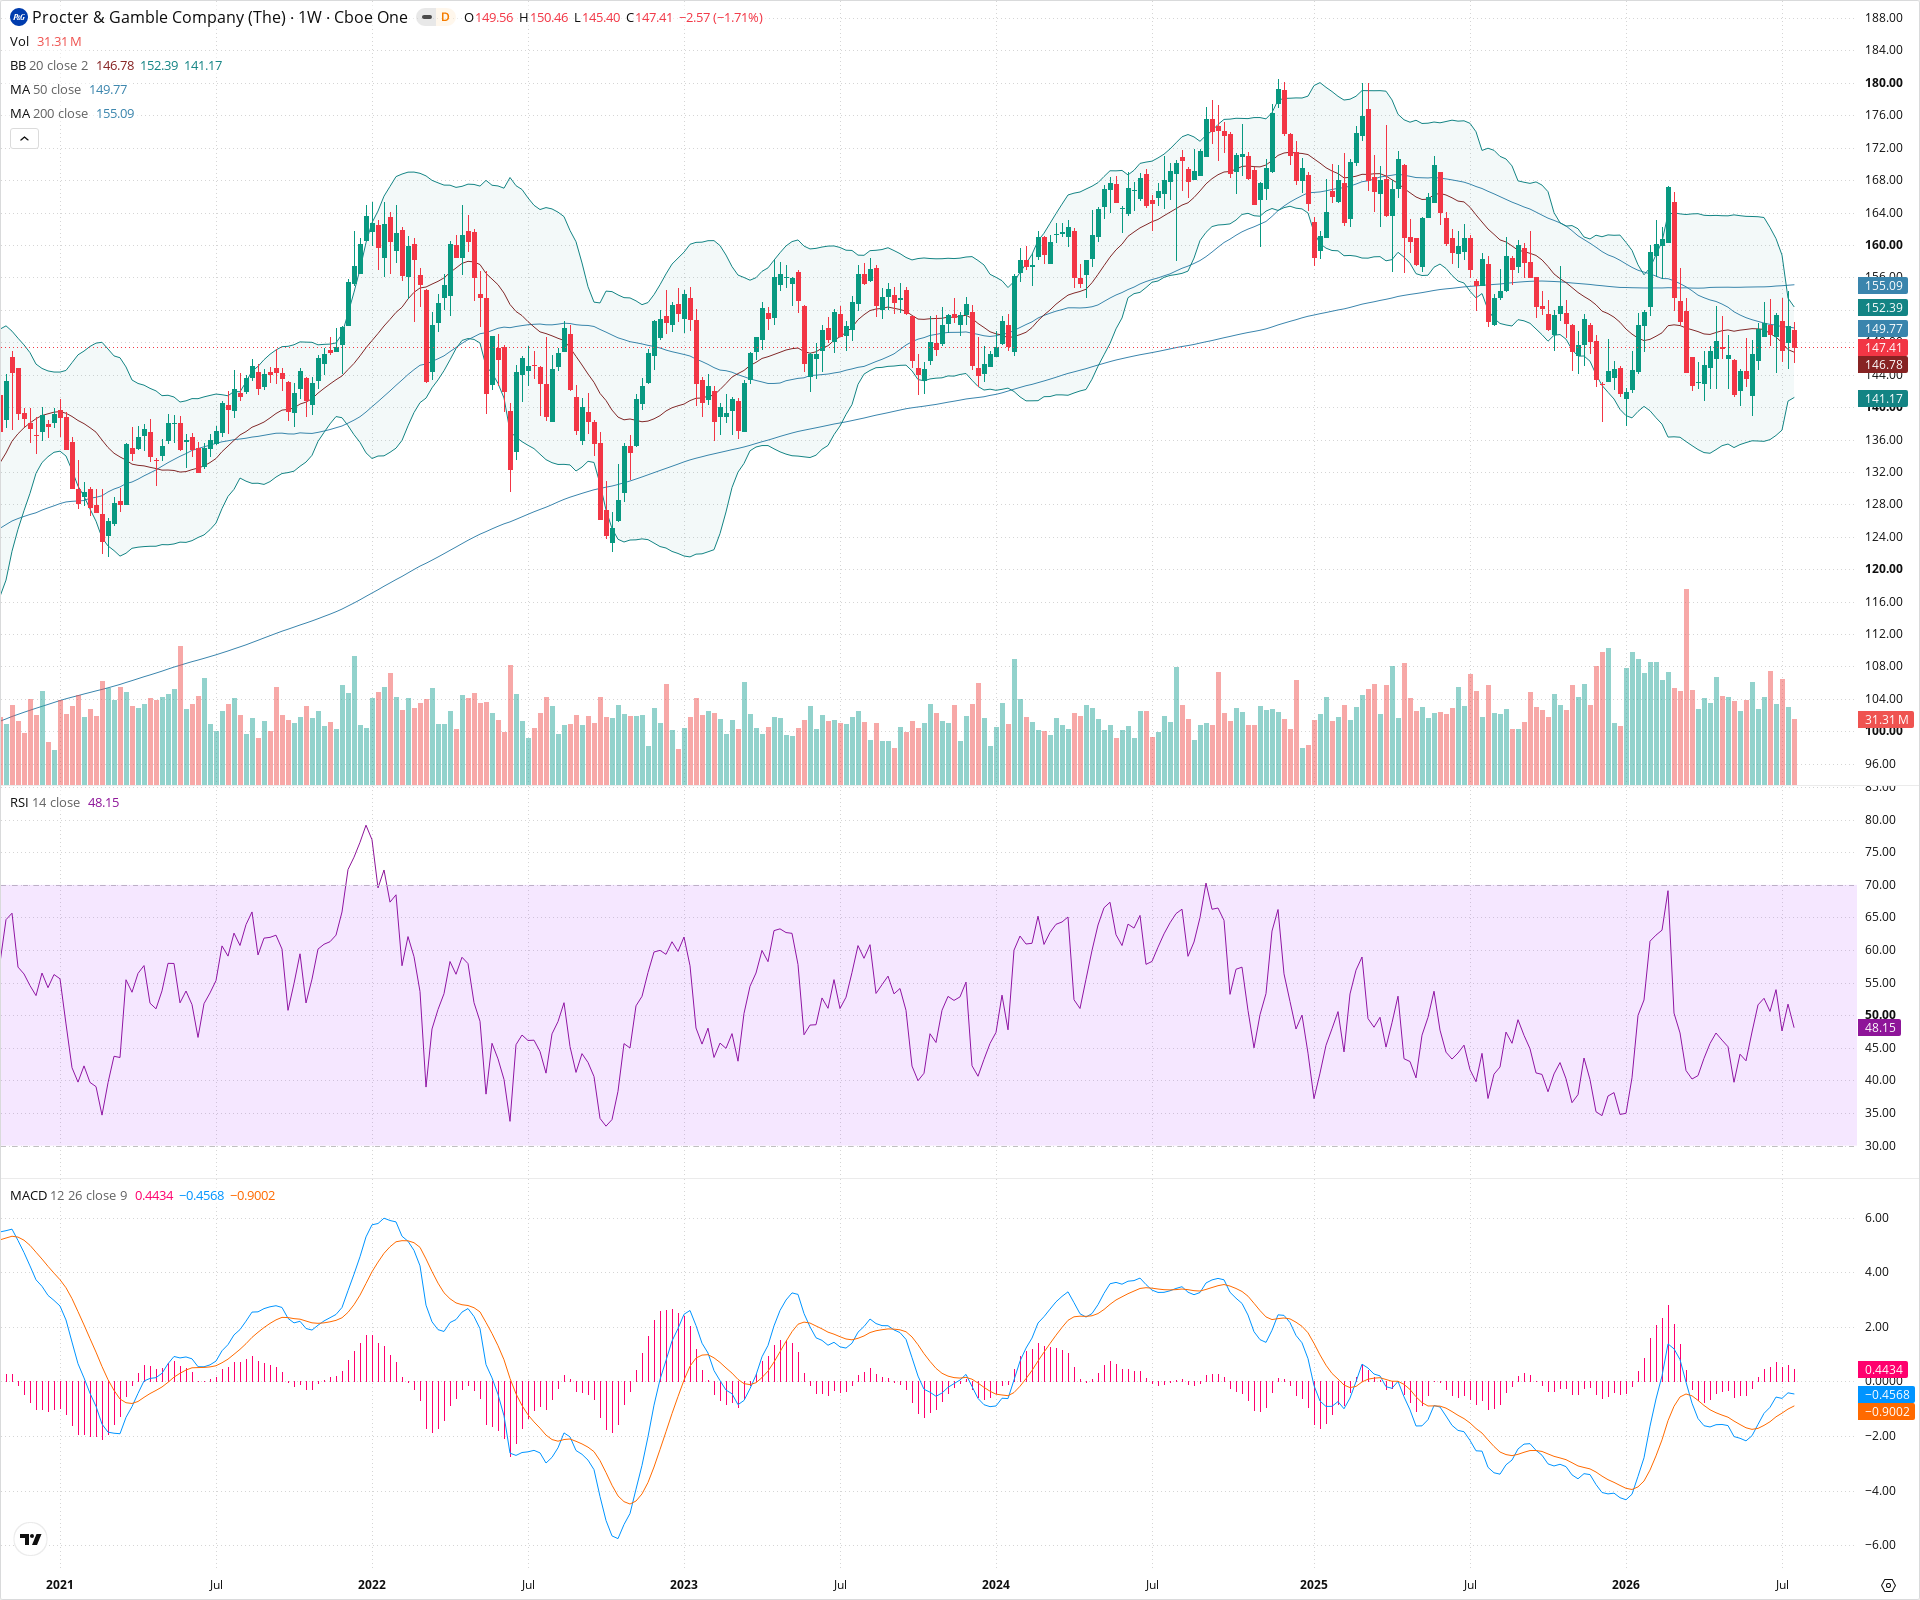
PG is exhibiting a major long-term trend reversal on the weekly timeframe. The chart shows a large distribution top culminating in a break below the 200-week SMA and a bearish moving average crossover (Death Cross). With momentum indicators aligning bearishly and price trapped under heavy moving average resistance, the structural bias remains firmly to the downside unless the price can reclaim the 156 level.
Included In Lists
Related Tickers of Interest
PG Weekly Chart
Sentiment
Short-term Sentiment (days to weeks): Bearish
Price is trading below the 50-week and 200-week SMAs, making lower highs and lower lows from the recent peak. MACD is in a bearish cross with a negative histogram, and RSI is below the 50 midline, indicating downward momentum.
Long-term Sentiment (weeks to months): Bearish
A significant structural breakdown has occurred. The price has definitively broken below the 200-week SMA, and a weekly 'Death Cross' is visible where the 50-week SMA has crossed below the 200-week SMA, signaling a major trend reversal from the prior long-term uptrend.
Report Metadata
- Timeframe: weekly
- Generated at: 2026-07-25T09:04:41.094Z
- Model: gemini-3.1-pro-preview
Support Price Levels
| Level | Range | Strength | Notes |
|---|---|---|---|
| $142.50 | $140.00 - $145.00 | Strong | Critical multi-week support zone representing the recent major swing low and the 'neckline' of a large topping pattern. |
| $136.00 | $134.00 - $138.00 | Weak | Secondary structural support derived from prior consolidation lows visible on the left side of the chart. |
Resistance Price Levels
| Level | Range | Strength | Notes |
|---|---|---|---|
| $152.75 | $149.50 - $156.00 | Strong | Heavy overhead resistance zone containing both the 50-week SMA and the 200-week SMA. The price recently rejected sharply from this area. |
| $165.00 | $162.00 - $168.00 | Strong | The most recent prominent swing high ('right shoulder' of the topping formation). |
Potential Chart Patterns in Formation
| Strength | Pattern | Signal | Target | Details |
|---|---|---|---|---|
| Strong | Head and Shoulders Top (forming/active) | Bearish | N/A | A massive multi-year topping structure is visible with a left shoulder near 170, a head near 180, and a right shoulder near 165. The pattern is threatening to break down completely if support at 140-145 fails. |
Frequently Asked Questions about PG
What is the current sentiment for PG?
The short-term sentiment for PG is currently Bearish because Price is trading below the 50-week and 200-week SMAs, making lower highs and lower lows from the recent peak. MACD is in a bearish cross with a negative histogram, and RSI is below the 50 midline, indicating downward momentum.. The long-term trend is classified as Bearish.
What are the key support levels for PG?
StockDips.AI has identified key support levels for PG at $142.50 and $136.00. These levels may represent potential accumulation zones where buying interest could emerge.
Is PG in a significant dip or a Value Dip right now?
PG has a Value Score of 43/100. It is not currently flagged as a significant dip in the Top Dips list. It is not listed as a Value Dip because the long-term sentiment or value-score threshold does not qualify.
View the full interactive analysis on StockDips.AI.