SBUX Weekly Technical Analysis
Starbucks Corporation
Global coffeehouse chain offering beverages, food, and packaged goods through more than 35,000 locations worldwide.
SBUX Technical Analysis Summary
SBUX has undergone a significant structural shift on the weekly timeframe, rallying aggressively off deep lows to reclaim major moving averages. The long-term trend appears to be transitioning to bullish as a large basing pattern matures. While short-term consolidation or a 'handle' formation may occur near current resistance levels, the broader technical posture remains constructive as long as the critical $90-$95 support zone holds.
Included In Lists
Related Tickers of Interest
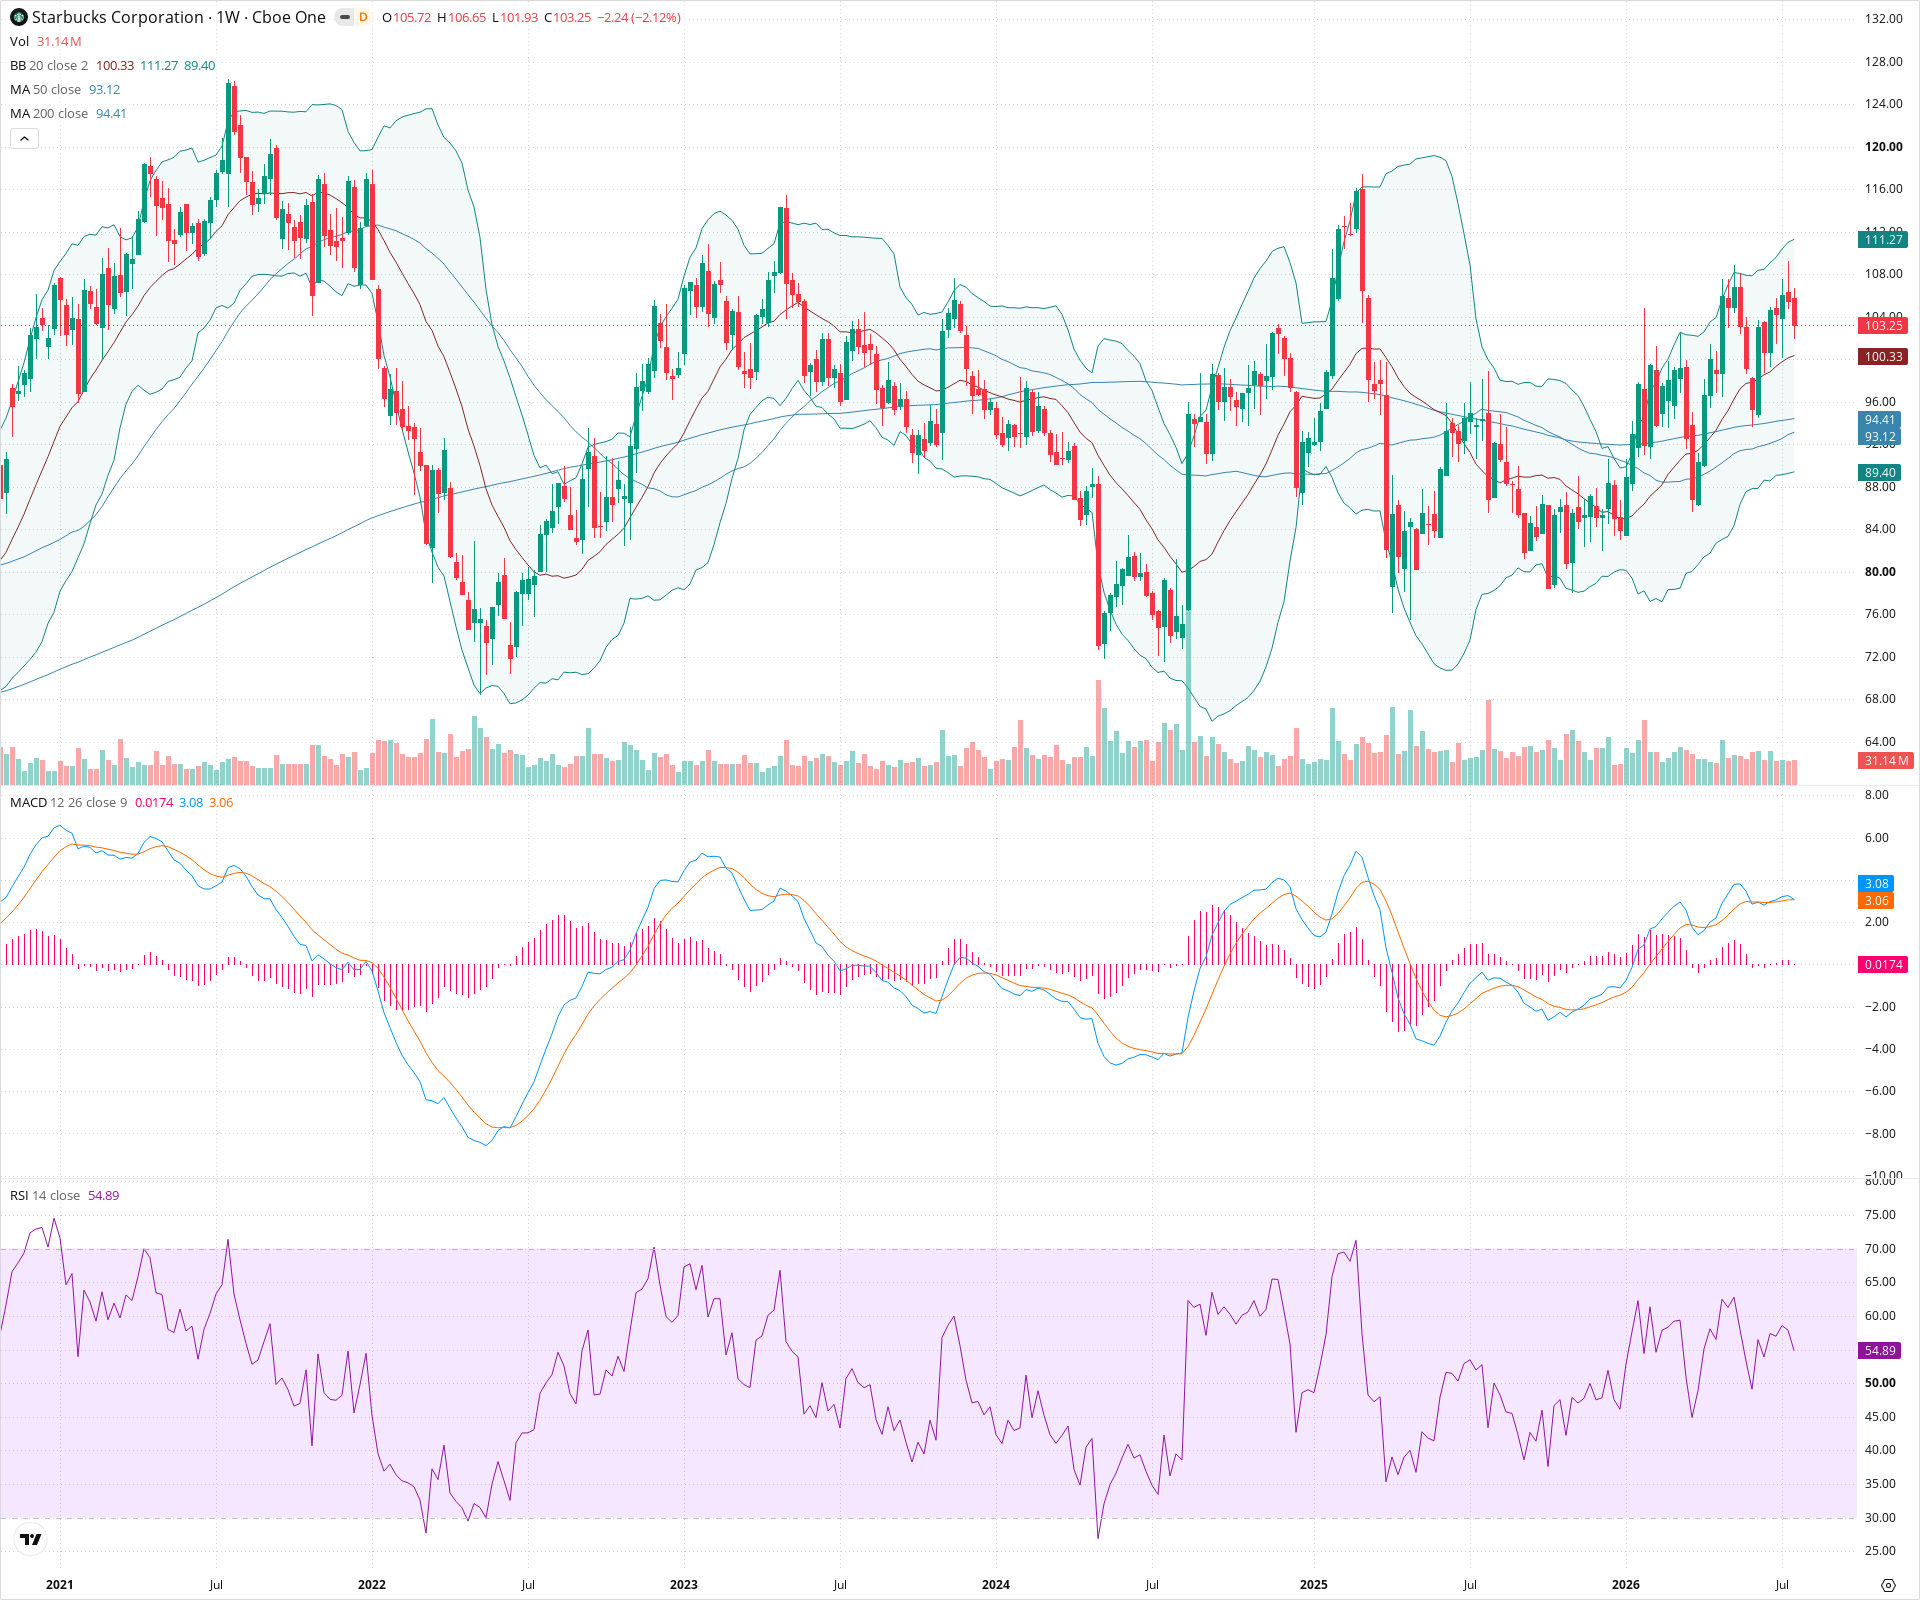
SBUX Weekly Chart
Sentiment
Short-term Sentiment (days to weeks): Bullish
Price has experienced a strong impulse move upward and remains above the rising 20-week SMA. The current pullback appears corrective, with RSI retreating from overbought levels but holding well above 50.
Long-term Sentiment (weeks to months): Bullish
The stock has established a major base, broken previous downtrend structures, and decisively reclaimed both the 50-week and 200-week SMAs. Weekly MACD is in positive territory, supporting structural improvement.
Report Metadata
- Timeframe: weekly
- Generated at: 2026-07-25T09:06:16.098Z
- Model: gemini-3.1-pro-preview
Support Price Levels
| Level | Range | Strength | Notes |
|---|---|---|---|
| $100.00 | $98.00 - $102.00 | Weak | Immediate support zone near the 20-week SMA and the psychological $100 level. |
| $92.50 | $90.00 - $95.00 | Strong | Major confluence zone containing the 50-week and 200-week SMAs, along with prior structural resistance turned support. |
| $74.00 | $72.00 - $76.00 | Strong | Massive multi-year structural support base. |
Resistance Price Levels
| Level | Range | Strength | Notes |
|---|---|---|---|
| $110.00 | $108.00 - $112.00 | Moderate | Recent weekly swing high and upper Bollinger Band area. |
| $116.50 | $115.00 - $118.00 | Strong | Major prior structural peak. |
| $126.00 | $124.00 - $128.00 | Strong | All-time high resistance zone. |
Potential Chart Patterns in Formation
| Strength | Pattern | Signal | Target | Details |
|---|---|---|---|---|
| Strong | Rounding Bottom / Large Base | Bullish | N/A | A large, multi-month basing structure starting from the major lows, indicating significant long-term accumulation before the recent breakout above key moving averages. |
Frequently Asked Questions about SBUX
What is the current sentiment for SBUX?
The short-term sentiment for SBUX is currently Bullish because Price has experienced a strong impulse move upward and remains above the rising 20-week SMA. The current pullback appears corrective, with RSI retreating from overbought levels but holding well above 50.. The long-term trend is classified as Bullish.
What are the key support levels for SBUX?
StockDips.AI has identified key support levels for SBUX at $100.00 and $92.50. These levels may represent potential accumulation zones where buying interest could emerge.
Is SBUX in a significant dip or a Value Dip right now?
SBUX has a Value Score of 82/100. It is currently flagged as a significant dip in the Top Dips list. It is also listed as a Value Dip because long-term sentiment is bullish.
View the full interactive analysis on StockDips.AI.