SMCI Weekly Technical Analysis
Super Micro Computer Inc
Builds high-performance servers and storage used in AI and cloud computing.
SMCI Technical Analysis Summary
SMCI is currently experiencing a strong short-term relief rally off a solid support base near the 17-20 level, aided by improving momentum indicators. However, long-term investors should remain cautious, as the overarching trend remains heavily bearish following a massive structural breakdown. The stock must reclaim the significant overhead resistance zone between 34 and 38, which houses the major moving averages, to begin repairing the long-term technical damage.
Included In Lists
Related Tickers of Interest
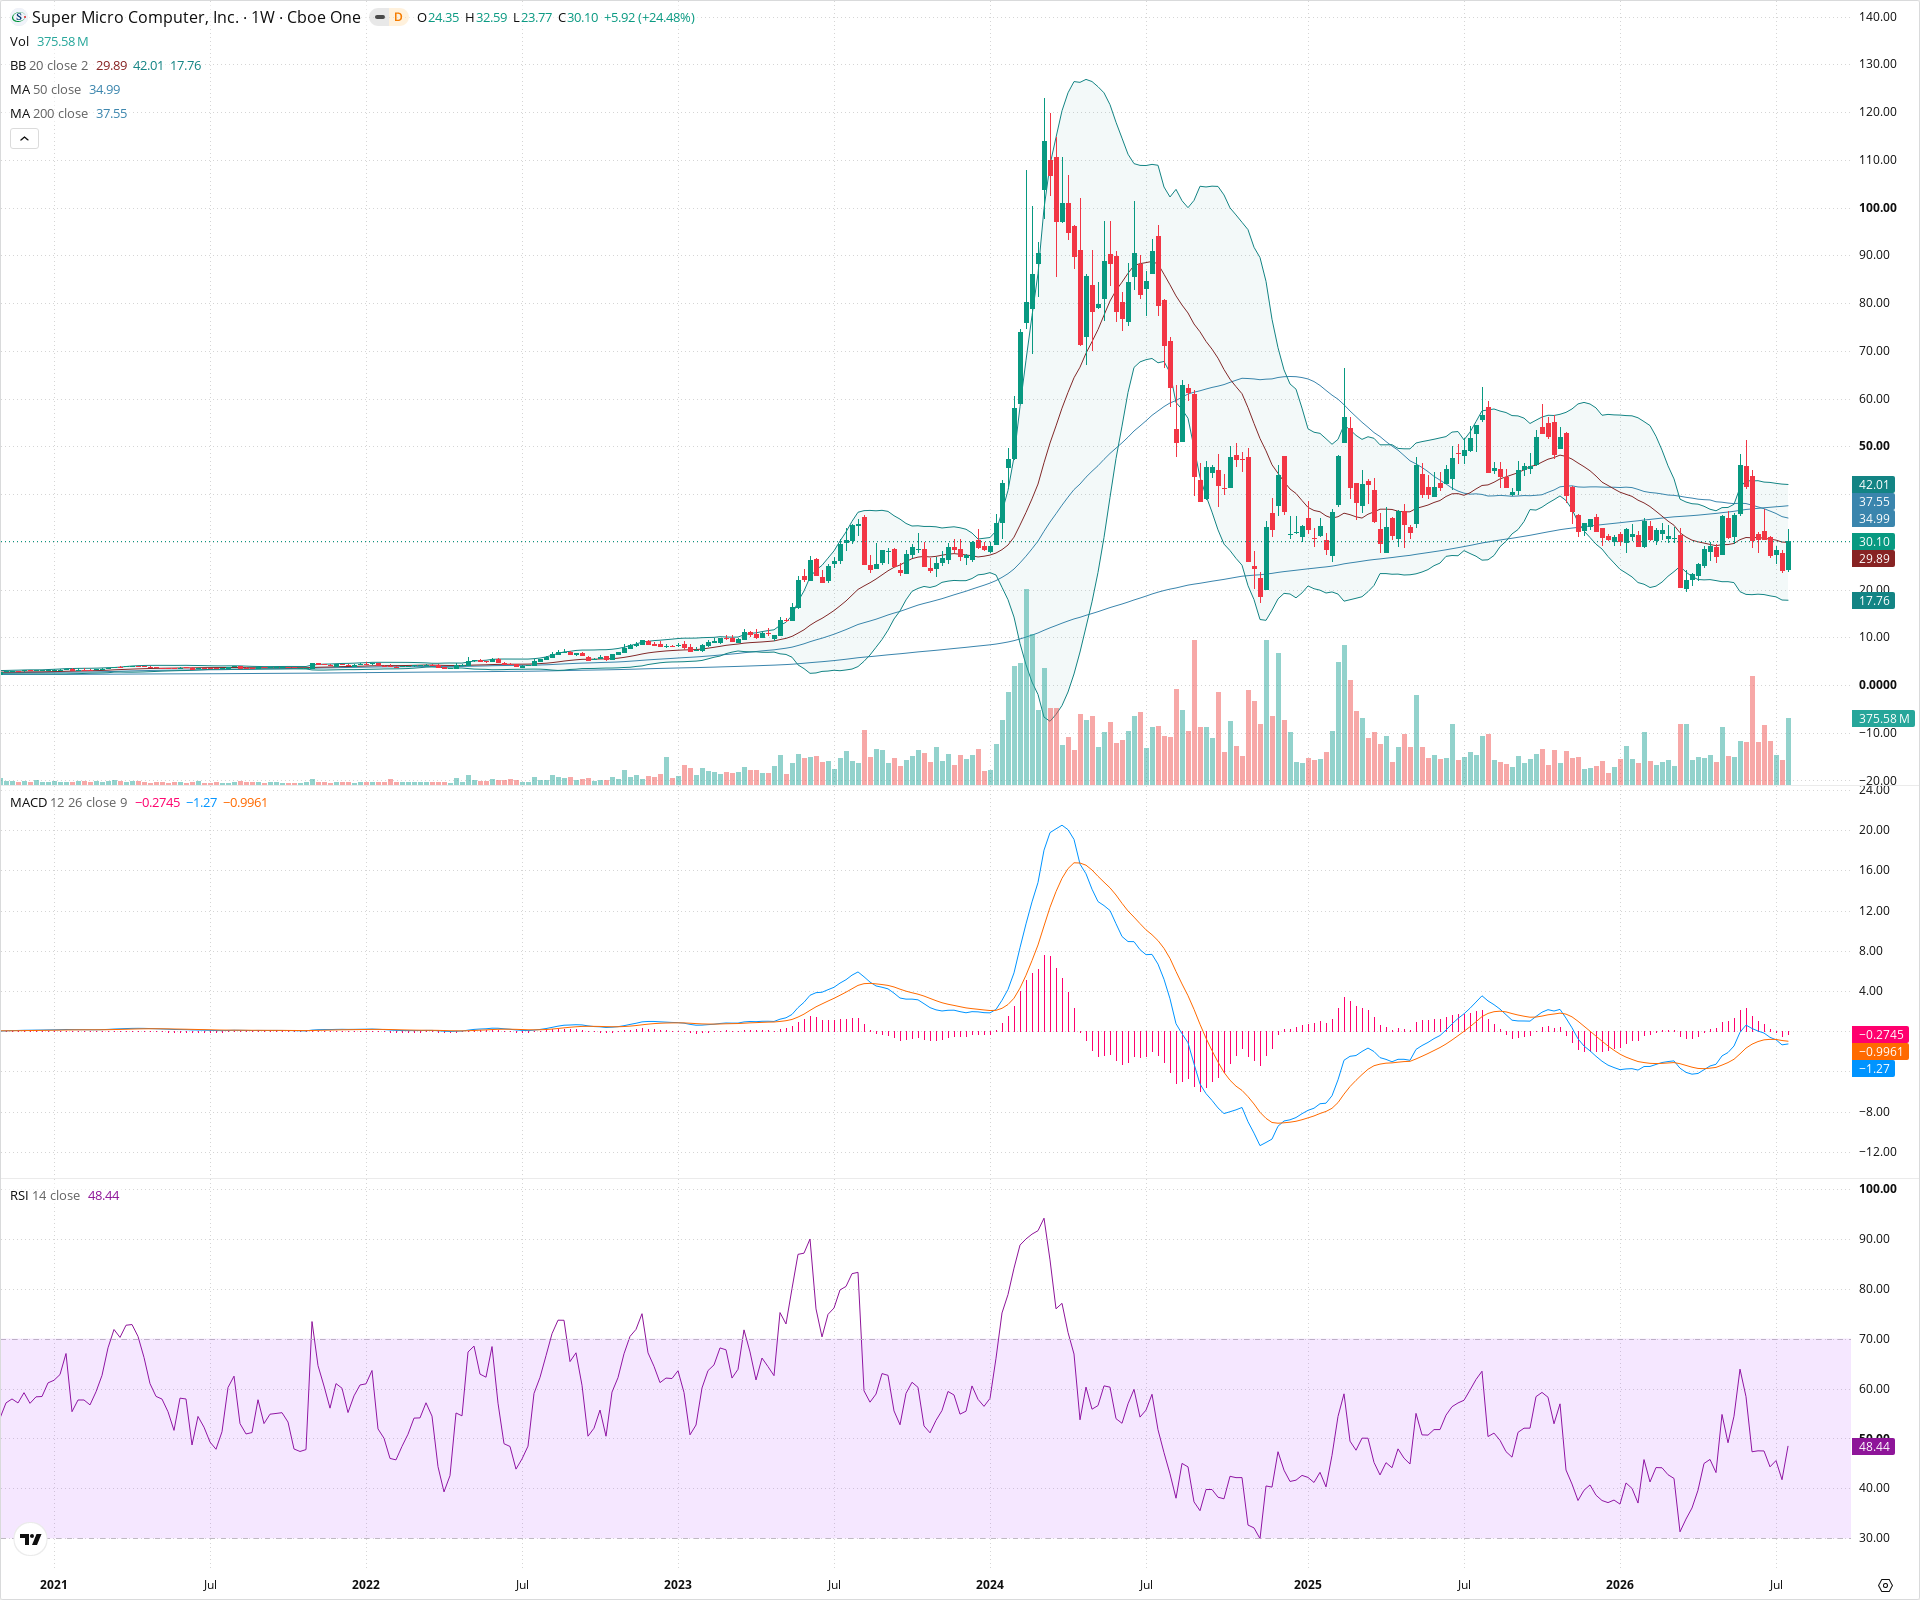
SMCI Weekly Chart
Sentiment
Short-term Sentiment (days to weeks): Bullish
Price has staged a strong bounce off major structural support with a large bullish weekly candle. The MACD has registered a bullish crossover below the zero line with an expanding positive histogram, and the RSI is pointing upward, suggesting growing short-term momentum.
Long-term Sentiment (weeks to months): Bearish
The broader structure is a massive parabolic reversal followed by a sustained downtrend. Price remains trapped below both the 50-week and 200-week SMAs, which are currently in a bearish alignment (50 SMA below 200 SMA), indicating long-term technical weakness.
Report Metadata
- Timeframe: weekly
- Generated at: 2026-07-25T09:07:27.799Z
- Model: gemini-3.1-pro-preview
Support Price Levels
| Level | Range | Strength | Notes |
|---|---|---|---|
| $18.50 | $17.00 - $20.00 | Strong | Major recent swing low zone where price has found significant buying interest multiple times, aligning with the lower Bollinger Band. |
Resistance Price Levels
| Level | Range | Strength | Notes |
|---|---|---|---|
| $36.00 | $34.00 - $38.00 | Strong | Critical overhead resistance zone containing the converging 50-week and 200-week SMAs, as well as prior consolidation structure. |
| $52.50 | $50.00 - $55.00 | Strong | Major structural lower-high formed during the extended downtrend. |
Potential Chart Patterns in Formation
| Strength | Pattern | Signal | Target | Details |
|---|---|---|---|---|
| Strong | Support Base / Consolidation | Bullish | $35.00 | After a prolonged decline, price has established a clear floor in the 17-20 region, rejecting lower prices and beginning to bounce, attempting to build a foundation. |
| Strong | Parabolic Reversal | Bearish | N/A | The macro chart is defined by an extreme speculative run-up followed by a harsh structural breakdown, reflecting a long-term shift from accumulation to distribution. |
Frequently Asked Questions about SMCI
What is the current sentiment for SMCI?
The short-term sentiment for SMCI is currently Bullish because Price has staged a strong bounce off major structural support with a large bullish weekly candle. The MACD has registered a bullish crossover below the zero line with an expanding positive histogram, and the RSI is pointing upward, suggesting growing short-term momentum.. The long-term trend is classified as Bearish.
What are the key support levels for SMCI?
StockDips.AI has identified key support levels for SMCI at $18.50. These levels may represent potential accumulation zones where buying interest could emerge.
Is SMCI in a significant dip or a Value Dip right now?
SMCI has a Value Score of 55/100. It is not currently flagged as a significant dip in the Top Dips list. It is not listed as a Value Dip because the long-term sentiment or value-score threshold does not qualify.
View the full interactive analysis on StockDips.AI.