SPCX Monthly Technical Analysis
Space Exploration Technologies Corp
Space Exploration Technologies Corp. (SpaceX) designs, manufactures, and launches reusable orbital rockets and spacecraft, and operates the Starlink satellite internet constellation. Following its integration with xAI and X Corp., the company also develops artificial intelligence models (Grok), large-scale compute infrastructure (Colossus), and next-generation space-based computing technologies.
SPCX Technical Analysis Summary
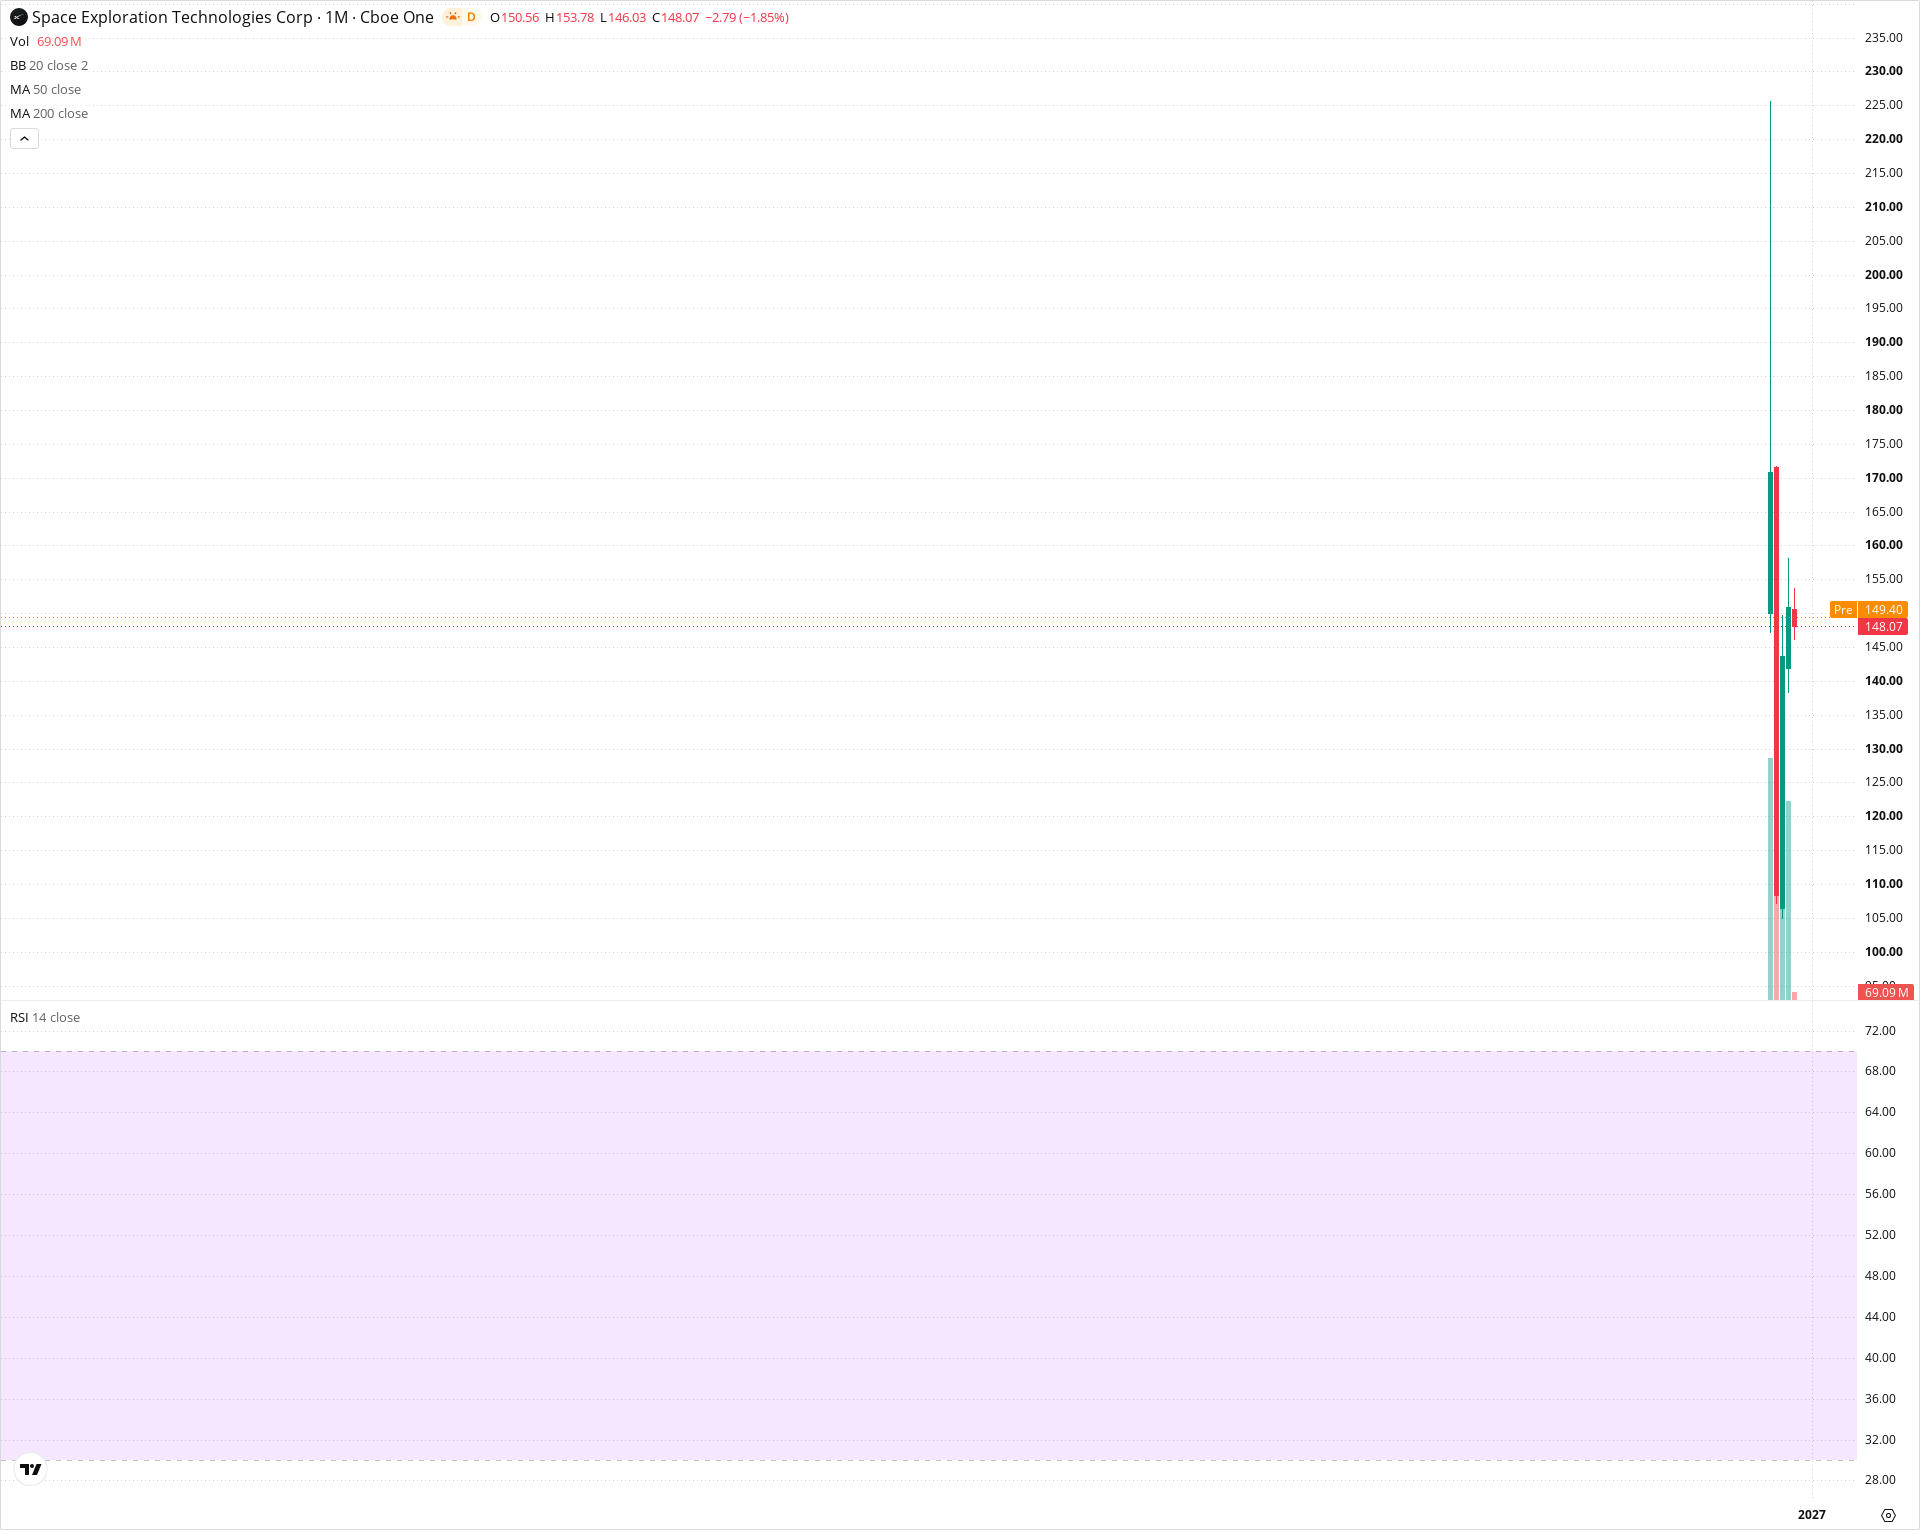
SPCX exhibits very limited monthly trading history, dominated by an initial parabolic wick to 225.00 followed by consolidation around the 148.00 level. Strong structural support rests near the base at 90.00-100.00, while the multi-month range is capped by resistance near 170.00-175.00. Until further price development establishes clearer multi-period moving averages, the secular posture remains neutral.
Included In Lists
Related Tickers of Interest
SPCX Monthly Chart
Sentiment
Short-term Sentiment (days to weeks): Neutral
Price is consolidating after a massive upper shadow rejection from the 225.00 level, currently holding in the upper-140s range across recent monthly candles.
Long-term Sentiment (weeks to months): Neutral
Extremely limited price history of only a few monthly bars provides insufficient data for long-term moving averages or established secular trend confirmation.
Report Metadata
- Timeframe: monthly
- Generated at: 2026-10-02T09:53:59.699Z
- Model: gemini-3.8-flash
Support Price Levels
| Level | Range | Strength | Notes |
|---|---|---|---|
| $137.50 | $135.00 - $140.00 | Moderate | Recent consolidation lows and buying support area across the last several monthly candles. |
| $95.00 | $90.00 - $100.00 | Strong | Base of the historical trading range and origin of the visible monthly price action. |
Resistance Price Levels
| Level | Range | Strength | Notes |
|---|---|---|---|
| $172.50 | $170.00 - $175.00 | Moderate | Monthly candle body closes and local highs from the initial explosive breakout. |
| $222.50 | $220.00 - $225.00 | Strong | All-time high peak established by the extreme upper wick. |
Potential Chart Patterns in Formation
| Strength | Pattern | Signal | Target | Details |
|---|---|---|---|---|
| Moderate | Consolidation Range | Neutral | N/A | Sideways compression following an initial high-volatility spike, with price stabilizing between 140 and 160. |
Frequently Asked Questions about SPCX
What is the current sentiment for SPCX?
The short-term sentiment for SPCX is currently Neutral because Price is consolidating after a massive upper shadow rejection from the 225.00 level, currently holding in the upper-140s range across recent monthly candles.. The long-term trend is classified as Neutral.
What are the key support levels for SPCX?
StockDips.AI has identified key support levels for SPCX at $137.50 and $95.00. These levels may represent potential accumulation zones where buying interest could emerge.
Is SPCX in a significant dip or a Value Dip right now?
SPCX has a Value Score of 58/100. It is not currently flagged as a significant dip in the Top Dips list. It is not listed as a Value Dip because the long-term sentiment or value-score threshold does not qualify.
View the full interactive analysis on StockDips.AI.