SPCX Weekly Technical Analysis
Space Exploration Technologies Corp
Space Exploration Technologies Corp. (SpaceX) designs, manufactures, and launches reusable orbital rockets and spacecraft, and operates the Starlink satellite internet constellation. Following its integration with xAI and X Corp., the company also develops artificial intelligence models (Grok), large-scale compute infrastructure (Colossus), and next-generation space-based computing technologies.
SPCX Technical Analysis Summary
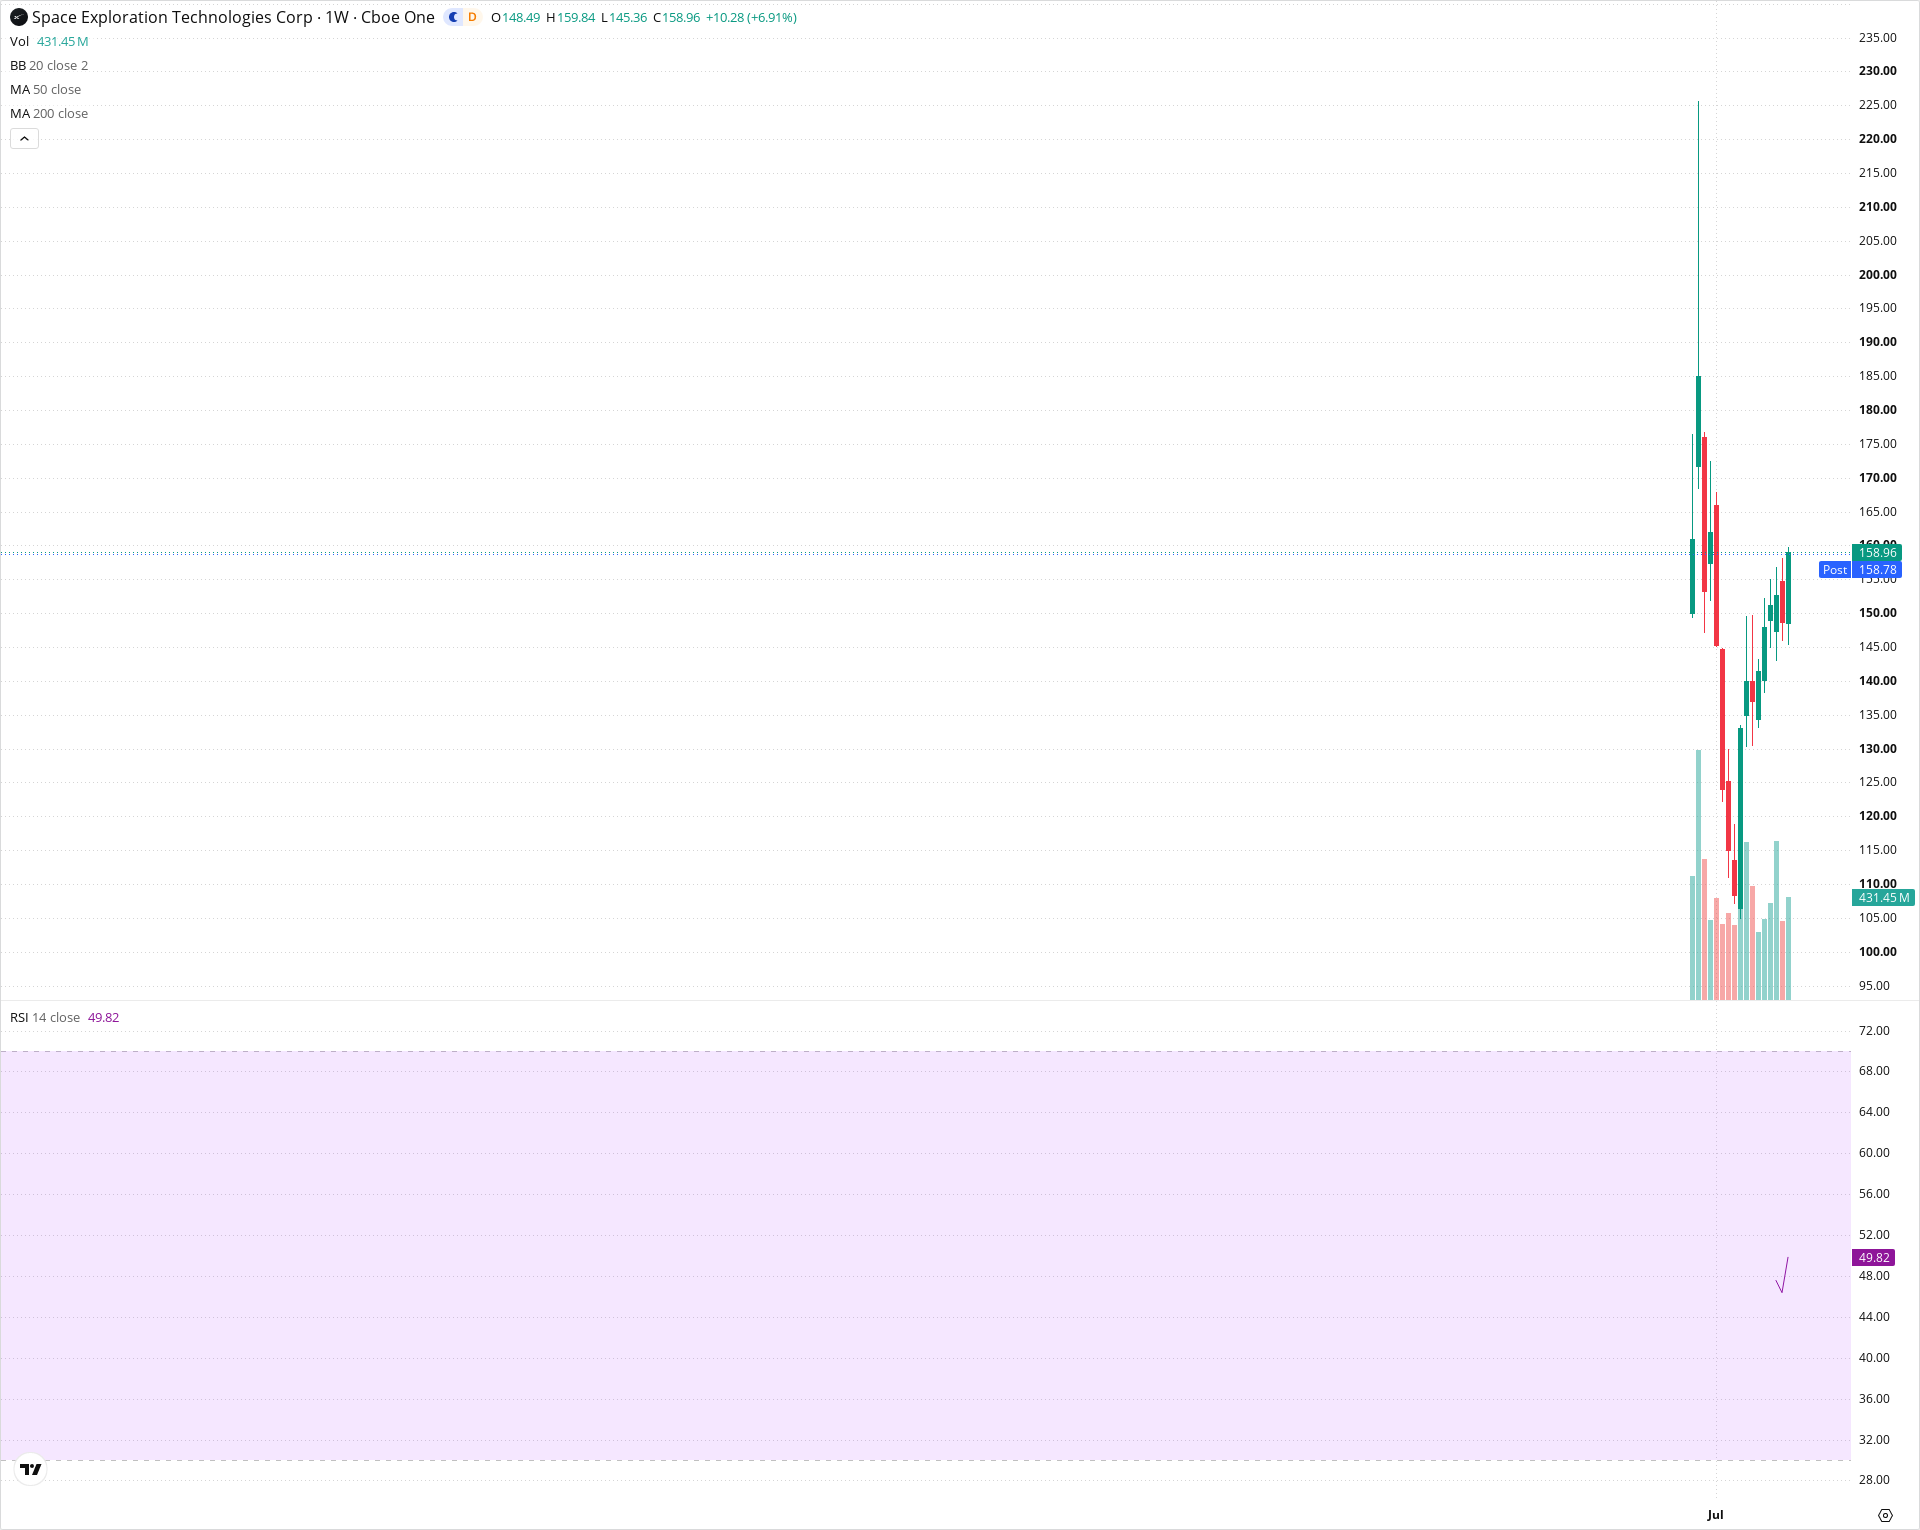
Since finding a definitive floor near 105.00, the stock has staged a sharp multi-week recovery back toward the 160.00 area. RSI has rebounded to near 50, signaling that downside selling pressure has largely normalized. A sustained weekly close above the 160.00-170.00 resistance band is needed to target a retest of the upper range near 180.00-200.00.
Included In Lists
Related Tickers of Interest
SPCX Weekly Chart
Sentiment
Short-term Sentiment (days to weeks): Bullish
Strong multi-week upward momentum off the 105 base, printing consecutive higher weekly closes and pushing back toward the initial trading range.
Long-term Sentiment (weeks to months): Neutral
Limited price history since debut prevents standard multi-year moving average analysis; price remains inside the broad post-IPO range below the 225 peak.
Report Metadata
- Timeframe: weekly
- Generated at: 2026-10-02T21:03:12.102Z
- Model: gemini-3.8-flash
Support Price Levels
| Level | Range | Strength | Notes |
|---|---|---|---|
| $140.00 | $135.00 - $145.00 | Moderate | Recent consolidation shelf formed during the current recovery leg. |
| $110.00 | $105.00 - $115.00 | Strong | Major structural swing low established after the initial post-debut sell-off. |
Resistance Price Levels
| Level | Range | Strength | Notes |
|---|---|---|---|
| $165.00 | $160.00 - $170.00 | Moderate | Prior consolidation and breakdown zone following the initial debut spike. |
| $185.00 | $180.00 - $190.00 | Strong | Upper weekly candle closes marking supply before the spike to the 225 high. |
Potential Chart Patterns in Formation
| Strength | Pattern | Signal | Target | Details |
|---|---|---|---|---|
| Moderate | V-Shaped Recovery | Bullish | $180.00 | Sharp rebound following a steep multi-week decline down to 105, with consistent weekly green candles retracing over half the move. |
Frequently Asked Questions about SPCX
What is the current sentiment for SPCX?
The short-term sentiment for SPCX is currently Bullish because Strong multi-week upward momentum off the 105 base, printing consecutive higher weekly closes and pushing back toward the initial trading range.. The long-term trend is classified as Neutral.
What are the key support levels for SPCX?
StockDips.AI has identified key support levels for SPCX at $140.00 and $110.00. These levels may represent potential accumulation zones where buying interest could emerge.
Is SPCX in a significant dip or a Value Dip right now?
SPCX has a Value Score of 58/100. It is not currently flagged as a significant dip in the Top Dips list. It is not listed as a Value Dip because the long-term sentiment or value-score threshold does not qualify.
View the full interactive analysis on StockDips.AI.